The Basics of Financial Technical Analysis even in Crypto
Get 1000000 0FP0EXP Token to remove widget entirely!
Get 500000 0FP0EXP Token to remove my NFTS advertisements!
With my background in academics, I relied on fundamental analysis to invest in cryptocurrencies. After reading their whitepaper, using their products, seeing their roadmap, and surveying their competition, I performed amateur sentiment analysis which are watching the news, checking their Twitter account, and joined their Telegram group. However, those method only works effectively in gem hunting. Finding a project with good fundamentals but still very few knew about it, is almost a guarantee win investment strategy. My first win was Statera where deflationary loop was a revolution at the time where my $100 became $1000. Then DEXMEX, one of the first leverage trading in Uniswap from my $10000 into $20000 where I sold early which the peak was $30000. Finally JDI Yield from $10000 into $30000 where I sold early as well which peaked $140000. The problem is, what about already popular projects? Back then I was not interested in Polygon, Solana, Avalanche, Harmony One and so on because they already pumped, in an all time high which was too expensive in my eyes. I do not like buying assets that already pumped as all of my experiences in all of these coins, whenever I buy they always go down. Although I am fortunate enough to get in $100s in Polkadot, Cardano, Binance Smart Chain, and Kucoin Share where all of them became $1000s. So the question is, how can I know a good time to enter these good fundamentals but already popular projects? The answer I found is financial technical analysis. Back then I only use fundamental and sentiment analysis, lacking technical analysis where I cannot avoid: selling too early, selling too late, buying too late and worse at a fear of missing out (FOMO). Although technical analysis does not completely mitigate those problems, just learning the basics helps a lot. In this article, I list the basic materials where I left hyperlinks to the chapters I wrote in each headings so click on them to learn more of the basics in detail.
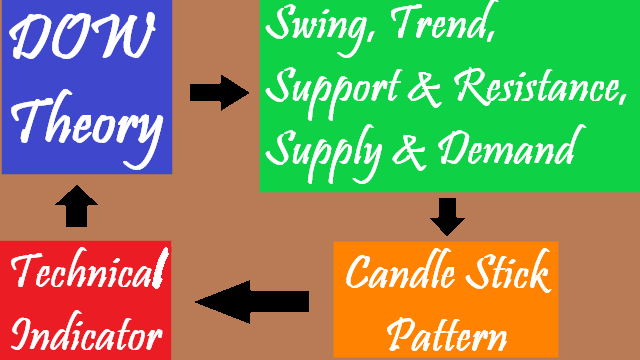
1. The DOW Theory
I have wrote my interpretation of the DOW theory in this chapter. I have also included my interpretation related to crypto in the featured. Now, I can even interpret another version about crypto which I believe that the DOW Theory is applicable in every market even the crypto market:
- The crypto market is never wrong. It is us analyst, believers, investors, and traders that are wrong. It is our fault for not reacting to Elon Musk’s tweet and the China Fud. Sure I believe the market is manipulated, but it is our fault for not being able to take advantage of these manipulations. People buy, people sell, people use, the market is how it is. (Originally, the market discounts everything.)
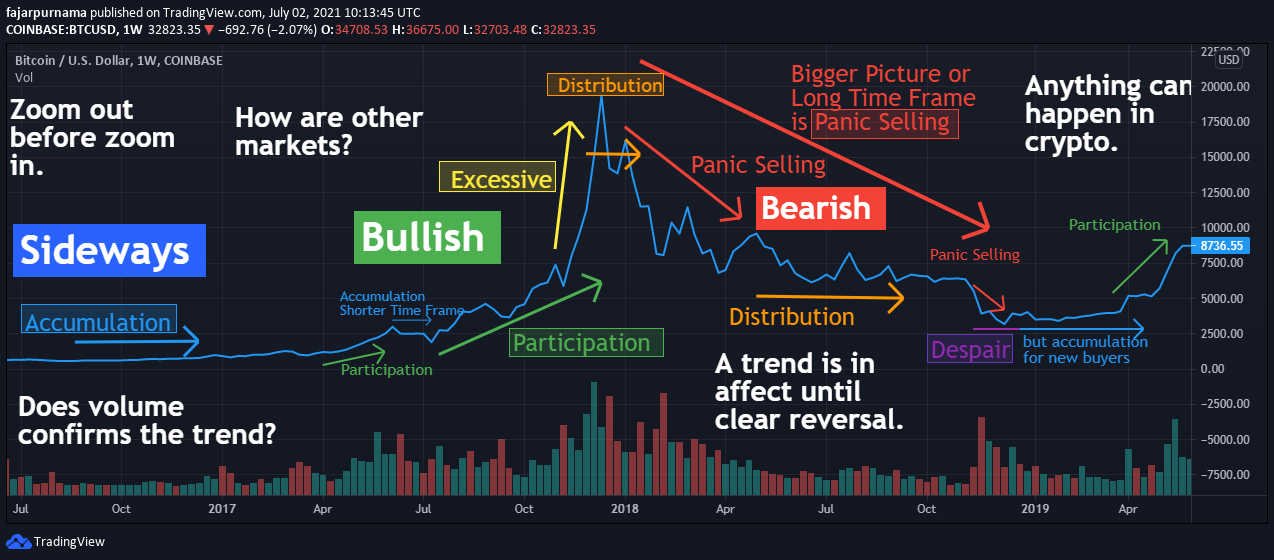
- For those of you saying that crypto is the worst performing asset, zoom out. As I am writing today, $30000 per Bitcoin is still an all time high compared to other years. 2017 all time high is around $20000 and all other years are lower than that. The whole picture shows Bitcoin is still bullish. (Originally, the are primary indices, secondary indices, and minor indices.)
- Yes most cryptocurrencies are in all time high this year but you lost money. That is your fault for not being aware of the excessive greed and for missing the panic selling phase. In the end, you are in despair but why not change to accumulate instead or dollar cost average (DCA)? Crypto is still early where few still are not aware of crypto. So accumulate and invite more people to crypto. (Originally, there are 3 trends and 6 phases.)
- Check the volume to see whether the next bull run starts again. When the volume is declining, really, take more time to pay special attention to the market to see whether we should take profit or not. (Originally, volume confirms the trend.)
- If the next bull market starts and you missed buying Bitcoin then buy other top coins. If you also missed out on that, then buy other altcoins, and finally even buy shitcoins. However, when popular coins are going down, really, just sell your other coins unless they are really uncorrelated. (Originally, market confirms each other.)
- Do not buy the top but buy the dip unless you really want the bull market to end. (Originally, trend persists until clear reversal.)
2. The Basic Drawings
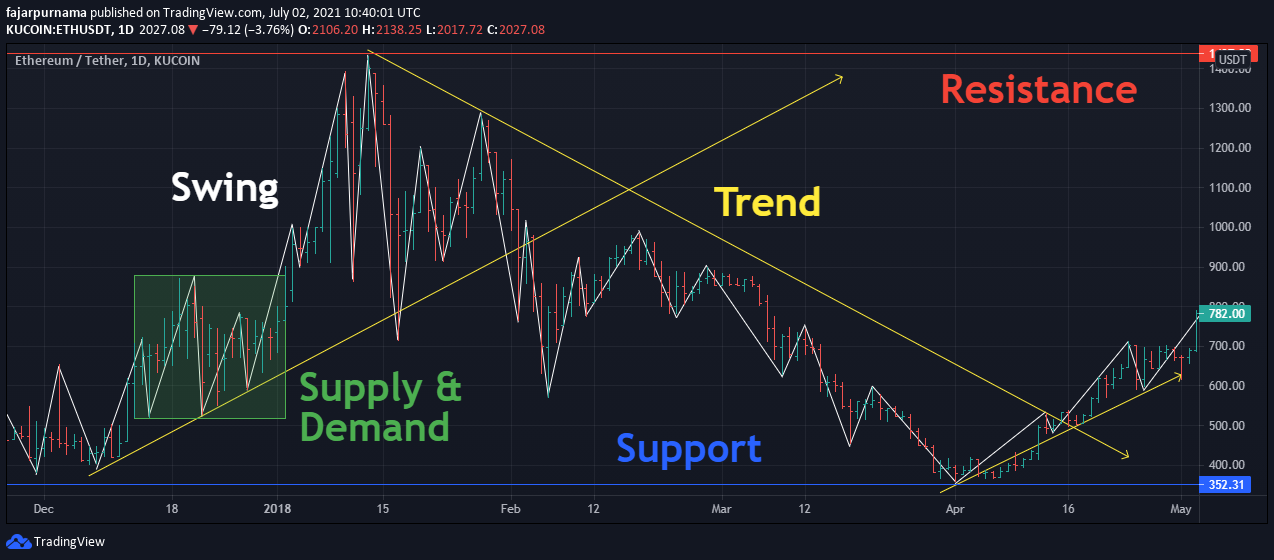
Out of all the basics, the basic drawing is where I practice the most. For pro traders if the chart patterns you drew were often mistaken, then probably your foundation in basic drawings are not strong enough yet. For us average people, just these basic drawing helps a lot in covering the missing pieces when just using fundamental and sentiment analysis. The basic drawings are:
- Swing: drawing the significant movements of the market by connecting the next significant buy pressure or sell pressure. This material is very rare even online but very crucial lines that determines the correctness of not only the following basics but even intermediate drawings such as chart pattern and Fibonacci sequence.
- Trend: the direction of the market whether it is bullish, bearish, or sideways.
- Support & Resistance: identifying the bottoms and the tops.
- Supply & Demand: areas of frequent buying and selling or areas of high probability of buying or selling.
3. Popular Candle Stick Patterns
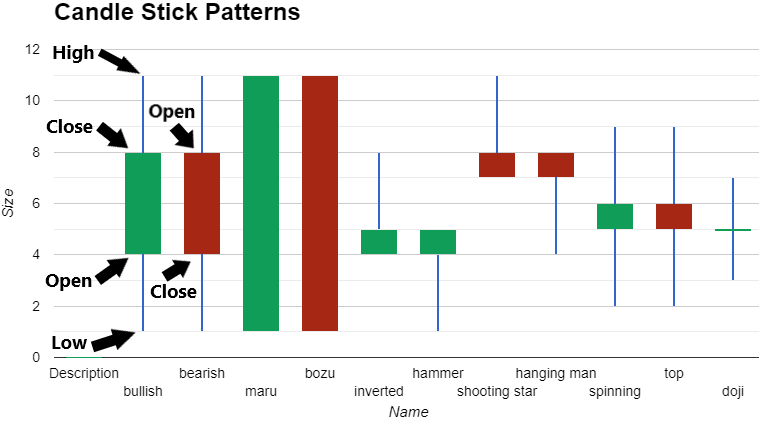
For beginner traders and investors, up to the candle stick pattern is enough to determine entry points. After minding the DOW Theory and drew basic lines, the next step is to find candle stick patterns. For example, the long time frame trend is bullish, the price corrected up to the closest support line, and the candle stick pattern followed by a bullish hammer shows our buy entry point. On the other hand, the long time frame trend is bearish, the price corrected up to the closest resistance line, and the candle stick pattern followed by a bearish shooting star we should consider taking profits. Again for us beginner traders and investors, just knowing the popular candle stick patterns helps a lot.
4. Popular Technical Indicators
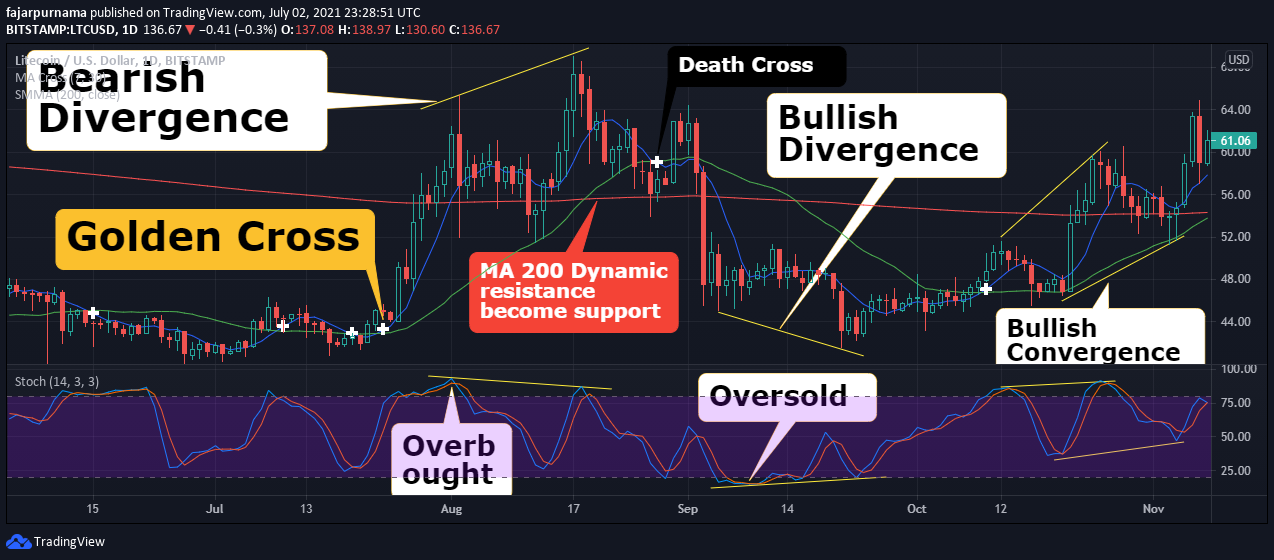
For me, after determining entry points, technical indicators helps to make sure my decision. I use momentum oscillators to identify overbought and oversold, convergence and divergence. In crypto, the term buy the dip is very popular, and went the overbought on the dip shows divergence, it is almost sure time to buy the dip. On the other hand, when the previous tops shows divergence in oversold, we should be careful as the coin can dip further. Other than oscillators, I used long term moving average to see potential future support and resistance, and intersections of short term and medium term moving averages to see whether we are in a down trend or up trend.
Example Applications
For Bitcoin Supporters
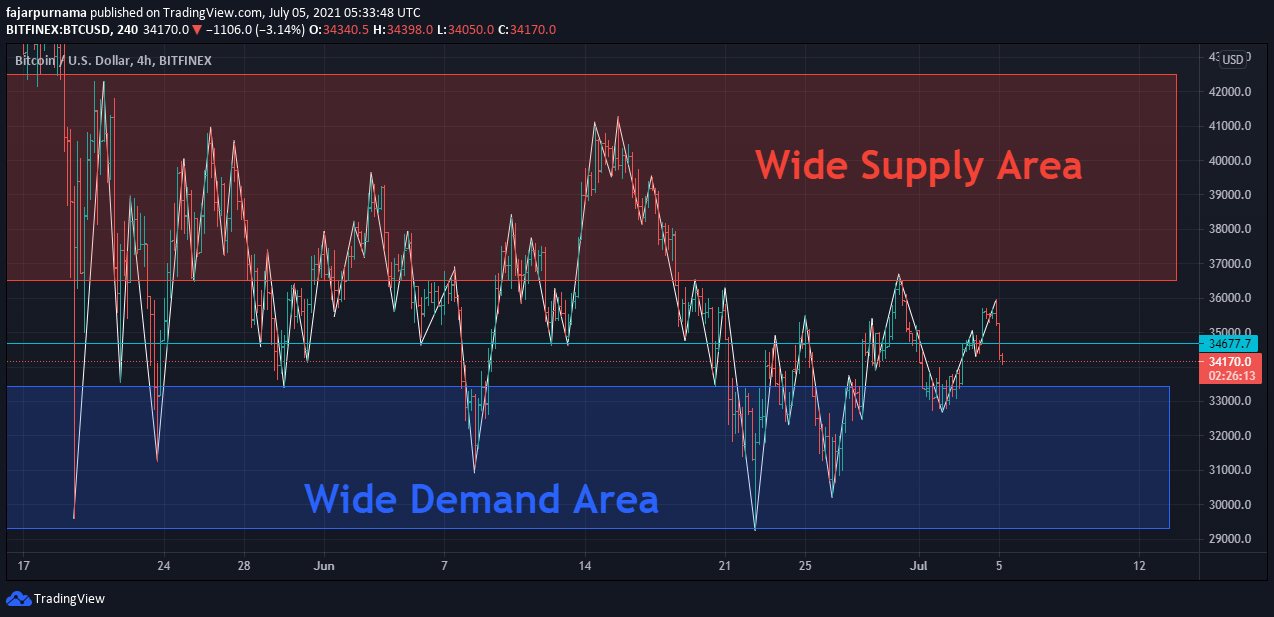
The current trend of Bitcoin during this few weeks is sideways. By drawing the swings we can determine many support and resistance levels. Finally, we can draw an area where the price is frequently supported and frequently resisted. It is recommended to buy periodically near the demand area below $33000 and avoid buying above $37000.
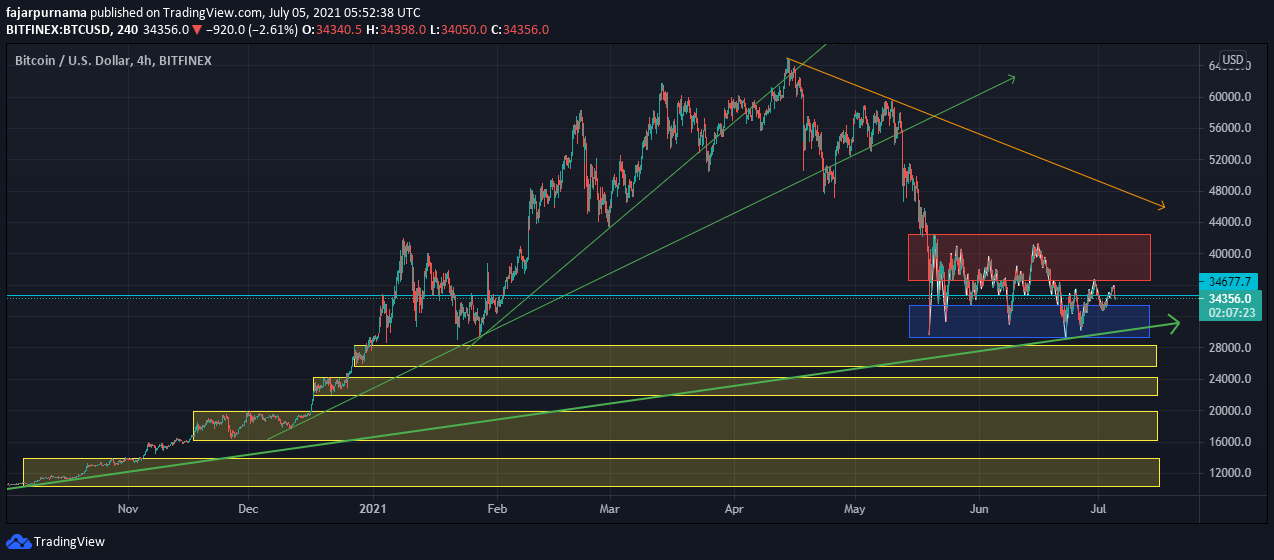
Bitcoin’s 3 months trend is bearish and as supporters, we want Bitcoin alive. What Bitcoin needs more are not people FOMO at the top, but supporters who buys at major dips. This will decrease volatility which will earn appreciations from people around the world and fear from some on those who wants to remain in financial power. One strong reason why the crypto space is alive today is because many people thinks many time that crypto is dead but was proven wrong every time. By knowing basic technical analysis, we can estimate critical price levels. From my drawing are $29000, around $27000, around $23000, around $17000, and around $12000. If you want to support Bitcoin, do not all in and other than dollar cost average (DCA), buy the dips on my mention price levels to support the asset. What about the bull market? Draw a trend line frequently draw adjustment trend line and buy every time the price nears the trend lines. If we have more people not FOMOing in at the top and supporting the trend line, we will see a long bullish time, and eventually to the moon.
Basic Trader vs Beginner Trader
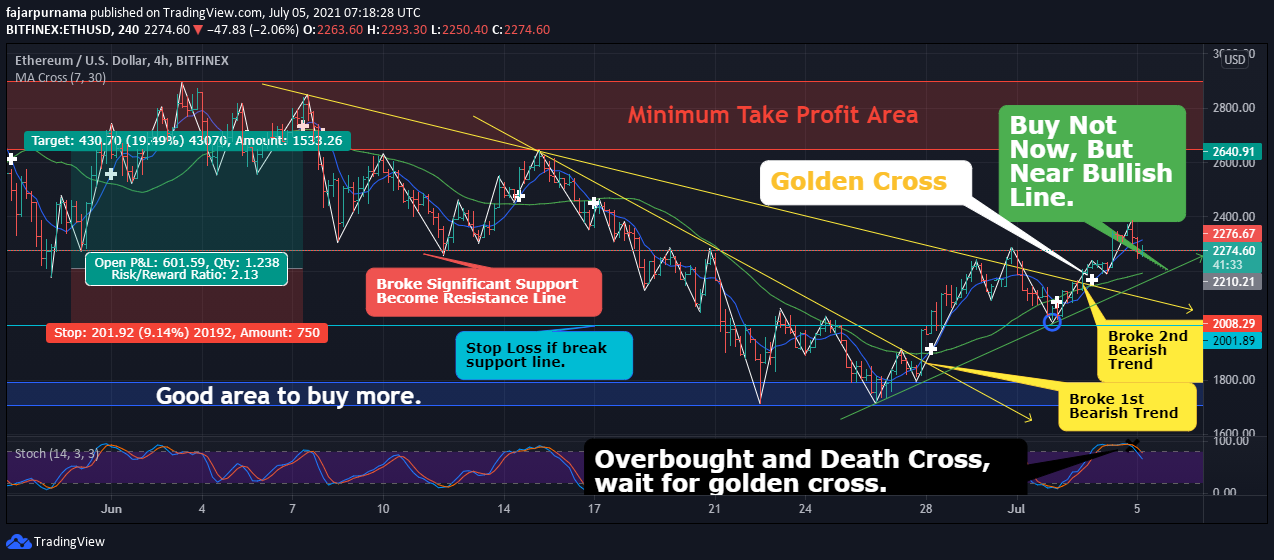
Just the basics without chart patterns, Fibonacci, methods, etc we can already perform basic trading. For example, my basic analysis on current Ethereum is wait until the price drops near the recent bullish trend line and buy because it already broke 2 bearish trend line and 2 resistances and the last moving average intersection shows a golden cross. The reason why not buying now and wait for lower price are because there are usually pull backs or corrections after breaking a resistance line and the stochastic oscillator seems to support the experience by showing overbought and a death cross, also the rejection was right on the long term moving average which was not shown due to not enough space on the chart. However, stop loss when plan does not go as intended when the price broke a sharp support level which will break the bullish trend. The minimum profit taking area is the next supply area. Finally, the risk reward is reasonable where the reward is 2 times the risk.
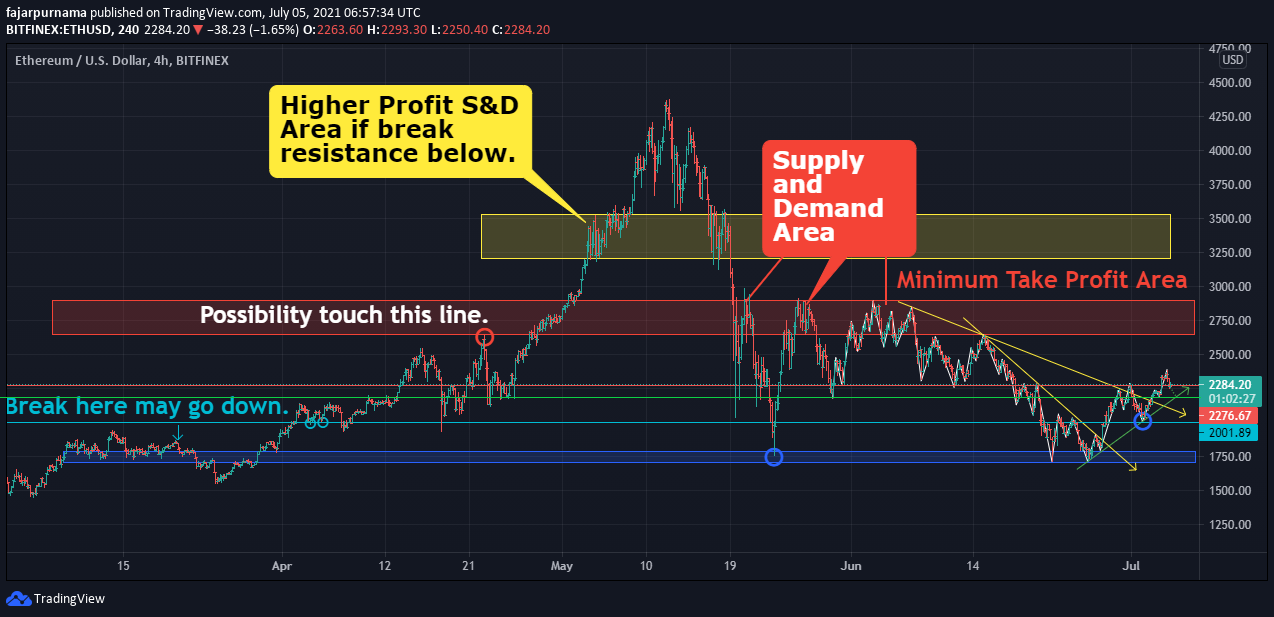
The DOW Theory told me to zoom out and see whether the areas and the line have connection with historical price and it does, supporting the analysis. For example, there is quite a distance between the support level and the next price area that have a high probability that when it breaks, it will visit that area. That is the plan for basic traders but for beginner traders or newcomers, their psychology are still take profit early and hold their losses, not knowing when to stop loss. That is still alright but the problem is almost everyone of them like to go all in. Stop loss is essential when all in or else risk losing everything. Thus, the difference between basic traders and beginner traders is that beginner traders does not know stop loss, additional in many decentralized finance (DeFi) trading there are still not stop loss feature. Therefore, the solution for beginner traders is to change stop loss to how much they are willing to lose. Buy as how I analyze above but with no stop loss and instead with how much we are willing to lose (apply the basic technical analysis but stop loss -> limit spending). For example, we are willing to lose no more than $10, so buy $10, if it increase than be grateful and if the it drops then just let the $10 go and forget about it.
Mirrors
- https://www.publish0x.com/cryptocurrency-101-for-users/the-basics-of-financial-technical-analysis-even-in-crypto-xgldxmk?a=4oeEw0Yb0B&tid=github
- https://0darkking0.blogspot.com/2021/07/the-basics-of-financial-technical.html
- https://0fajarpurnama0.medium.com/the-basics-of-financial-technical-analysis-even-in-crypto-d69bd5688f14
- https://0fajarpurnama0.github.io/cryptocurrency/2021/07/01/fta-crypto-basic
- https://hicc.cs.kumamoto-u.ac.jp/~fajar/cryptocurrency/fta-crypto-basic
- https://steemit.com/cryptocurrency/@fajar.purnama/the-basics-of-financial-technical-analysis-even-in-crypto?r=fajar.purnama
- https://leofinance.io/@fajar.purnama/the-basics-of-financial-technical-analysis-even-in-crypto?ref=fajar.purnama
- https://blurtter.com/cryptocurrency/@fajar.purnama/the-basics-of-financial-technical-analysis-even-in-crypto?referral=fajar.purnama
- https://0fajarpurnama0.wixsite.com/0fajarpurnama0/post/the-basics-of-financial-technical-analysis-even-in-crypto
- http://0fajarpurnama0.weebly.com/blog/the-basics-of-financial-technical-analysis-even-in-crypto
- https://0fajarpurnama0.cloudaccess.host/index.php/8-cryptocurrency/cryptocurrency-101-for-users/235-the-basics-of-financial-technical-analysis-even-in-crypto
- https://read.cash/@FajarPurnama/the-basics-of-financial-technical-analysis-even-in-crypto-bbbe3d5d
- https://trybe.one/the-basics-of-financial-technical-analysis-even-in-crypto
- https://www.floyx.com/article/0fajarpurnama0/the-basics-of-financial-technical-analysis-even-in-000113f7ae
- https://markethive.com/0fajarpurnama0/blog/thebasicsoffinancialtechnicalanalysisevenincrypto