Financial Technical Analysis Crypto Narrative Chapter 4 Indicators
Get 1000000 0FP0EXP Token to remove widget entirely!
Get 500000 0FP0EXP Token to remove my NFTS advertisements!
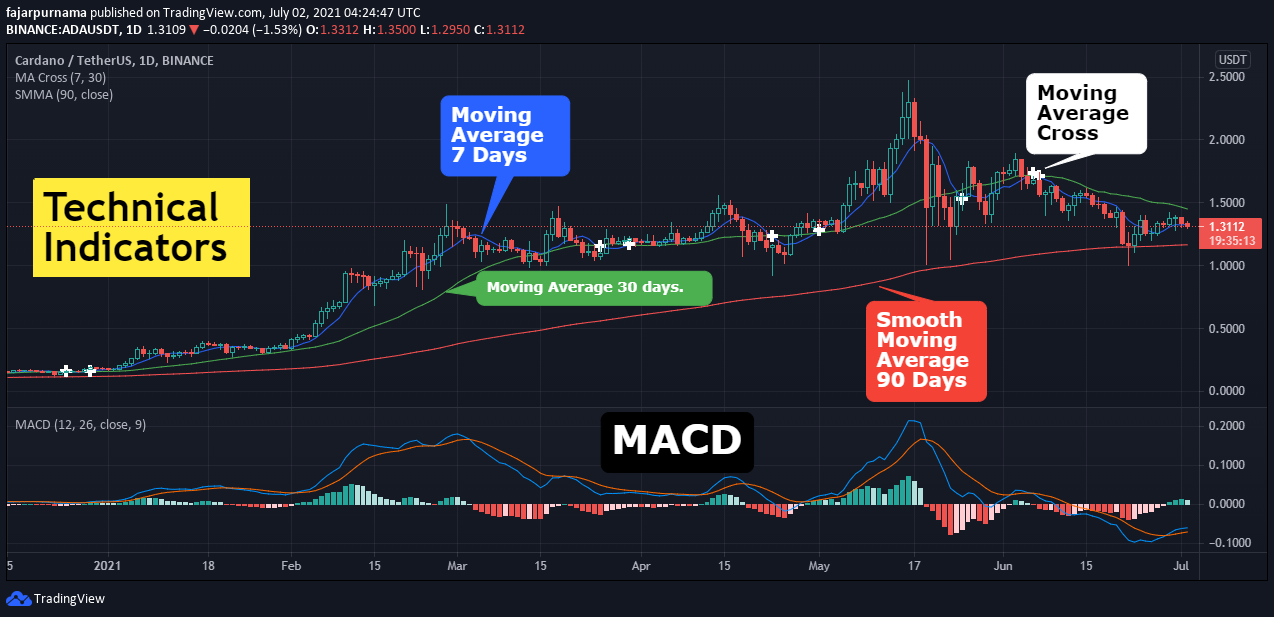
Indicator is literally an indicator to measure the current level or status of a certain thing for example gauge meter showing moving vehicle speed, thermometer showing temperature, mirrors showing our image, and even historical trading data showing previous prices and volumes. Technical indicators in financial technical analysis are heuristic or mathematical calculations of historical trading data which helps traders in making better trading decision by better predicting the future movement of the market. While the purpose are to help traders but technical indicators are still just tools which depends on how the traders use the tools. No matter how great the tool is, it is useless if the trader cannot utilize it well. For example using moving average is slightly different in cryptocurrency market because it is open 24 hours and 7 days (24/7) while traditional market opens only 8 hours and 5 days (8/5). Generally, technical indicator is divided into overlays and oscillators.
Overlays
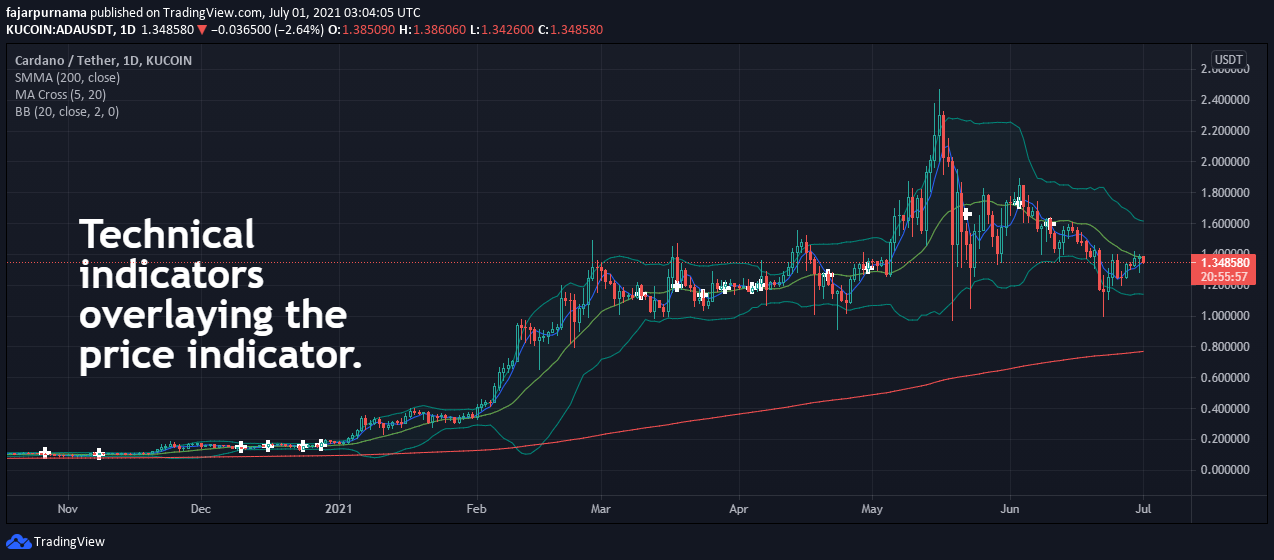
The word overlays really are technical indicators that are shown on the price feed or over the layer of the price. For beginners, it is not a good idea stacking too many overlays as it can actually make the analysis more complicated instead. Even professional traders does not stack much overlays and tries to keep it as simple as possible. Instead, they use multiple monitors. Still, back to each trader, make a setting that is comfortable.
Moving Average
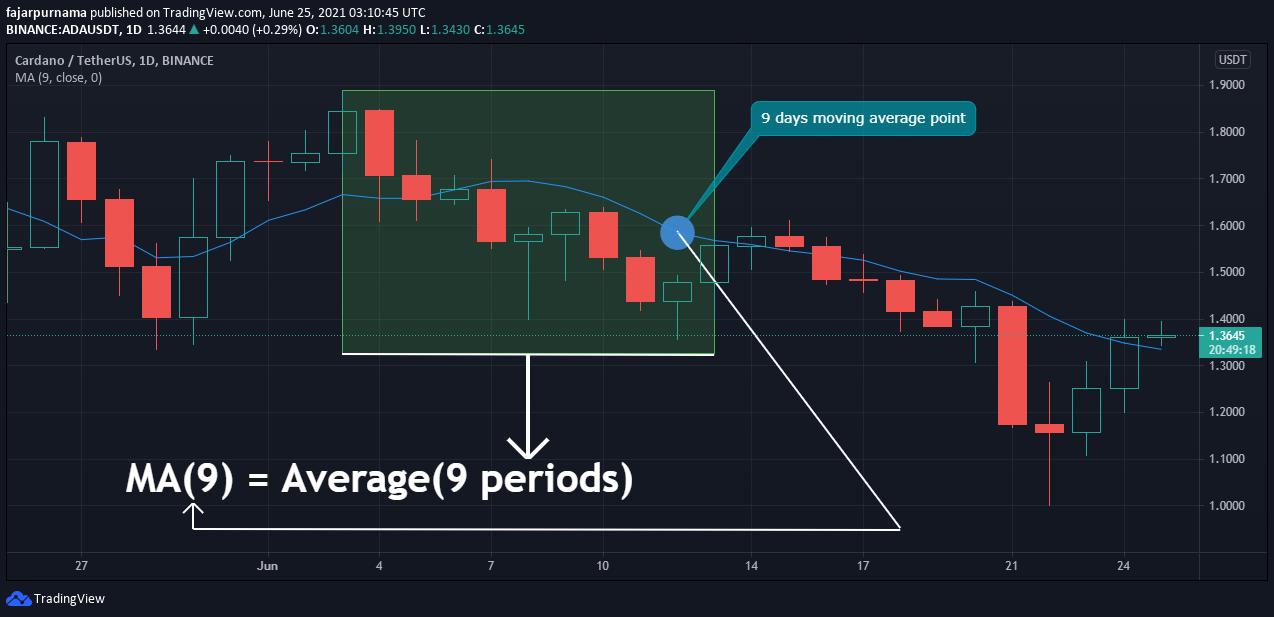
It is a line the plots the average prices of certain periods. A period is one bar or one candle. For example in the image above a 9 period moving average calculates the average of the 9 previous candle. Depending on the settings, the average can be the opening price, the closing price, the median price, or another parameter. Generally, moving average is to remove short term noises and see the average price movement of an asset where sometimes, the price indicator is hidden a we only see the moving average line. However, popularly moving average have two functions for higher level traders.
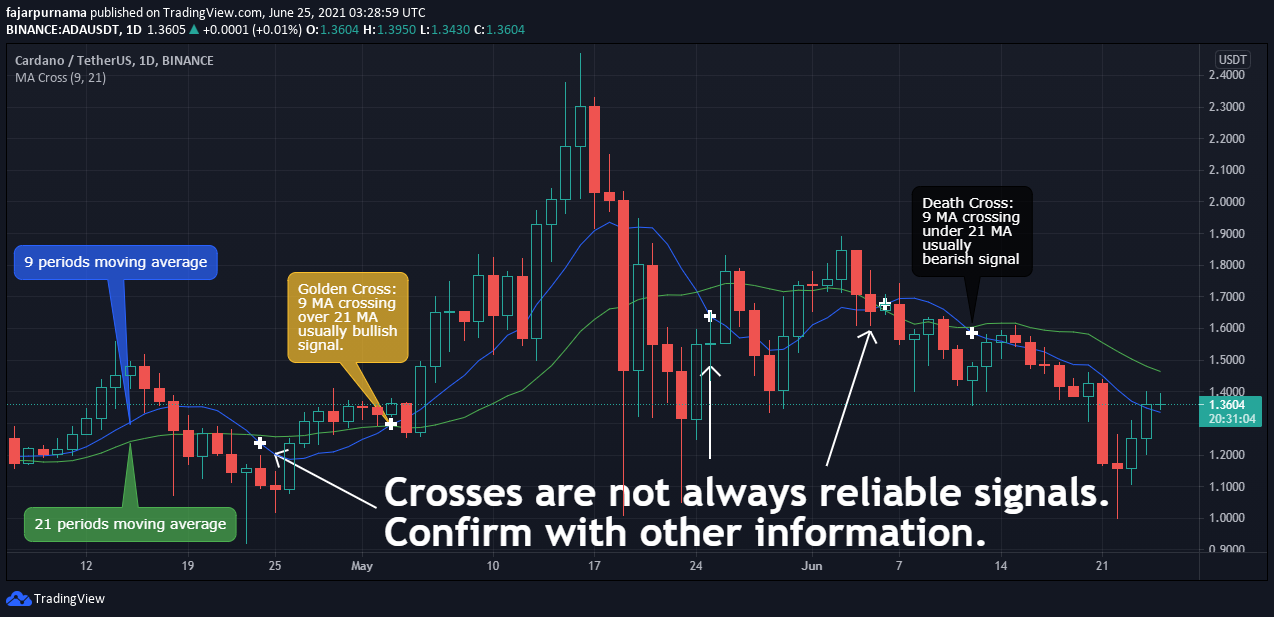
The first function is to signal price direction change, pull back, reversal, etc identified by intersections of two moving average line where one line is a shorter time frame and the other one is a longer time frame. When the shorter time frame crosses over the longer time frame is called the golden cross where often signals bullish movement and when the shorter time frame crosses under the longer time frame is called the death cross where often signals a bearish movement. The time frame used are usually 5 for shorter time frame and 20 for shorter time frame in the traditional market because 5 means 1 week where 5 working days and 2 holidays in weekends not counted and 20 means 1 month which is 4 weeks where 5 multiplied by 4. Another longer time frame is 50 days meaning 10 weeks and if not 50 then 60 days which means 3 months. In some crypto market, these numbers are still relevant as many traders still take breaks in Saturdays and Sundays. However not relevant for some as they really are open 24 hours and 7 days (24/7) meaning full working days without holidays where the shorter time frame are often 7 (1 week) and longer time frame 28, 29, 30, 31 (1 month) instead.
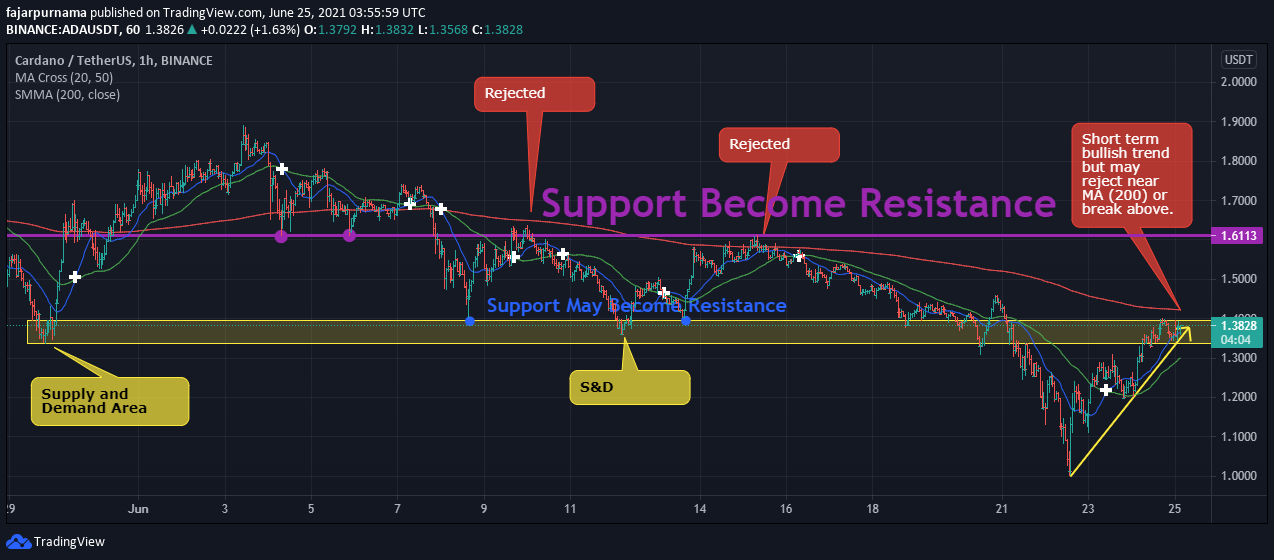
The second function is to signal probable dynamic support and resistance by using very long time frame such as 200 days meaning 10 months. The above image shows that often the 200 period moving average line near many supports and resistances point. Higher level traders uses this long time frame moving average to predict probable rejections as the image above, the new trend is bullish but requires attention when the trend meets the 200 moving average line as it will either break above or deflect the line potentially becoming a new resistance.
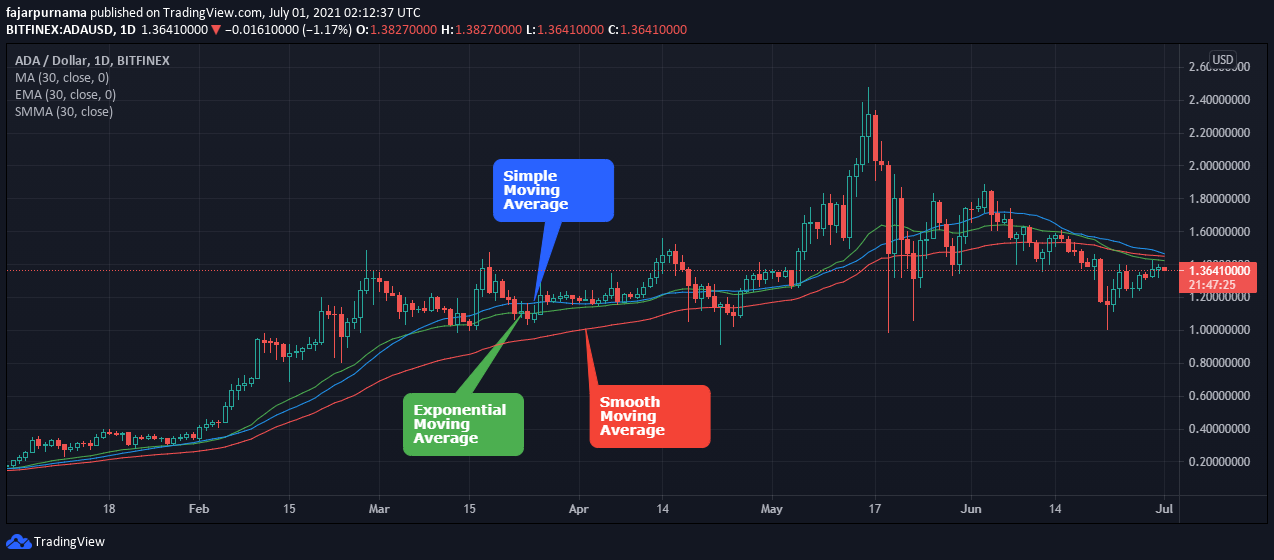
The are many different moving averages where the well known ones are simple moving average, exponential moving average, and smoothed moving average. Simple moving average is simply sum of prices divided by the number of periods. Exponential moving average gives more weight to recent prices which increases the sensitivity and smoothed moving average is similar to the combination of exponential moving average and simple moving average where not only it gives weight to recent prices but considers past data as well.
EMA(t) =[V(t) × (s/(1+d))] + EMA(y) × [1−(s/(1+d))]
where:
EMA(t) = Exponential Moving Average today
V(t) = Value today
EMA(y) = EMA yesterday
s = Smoothing (typically [2/(d + 1)])
d = Number of days
Bollinger Bands
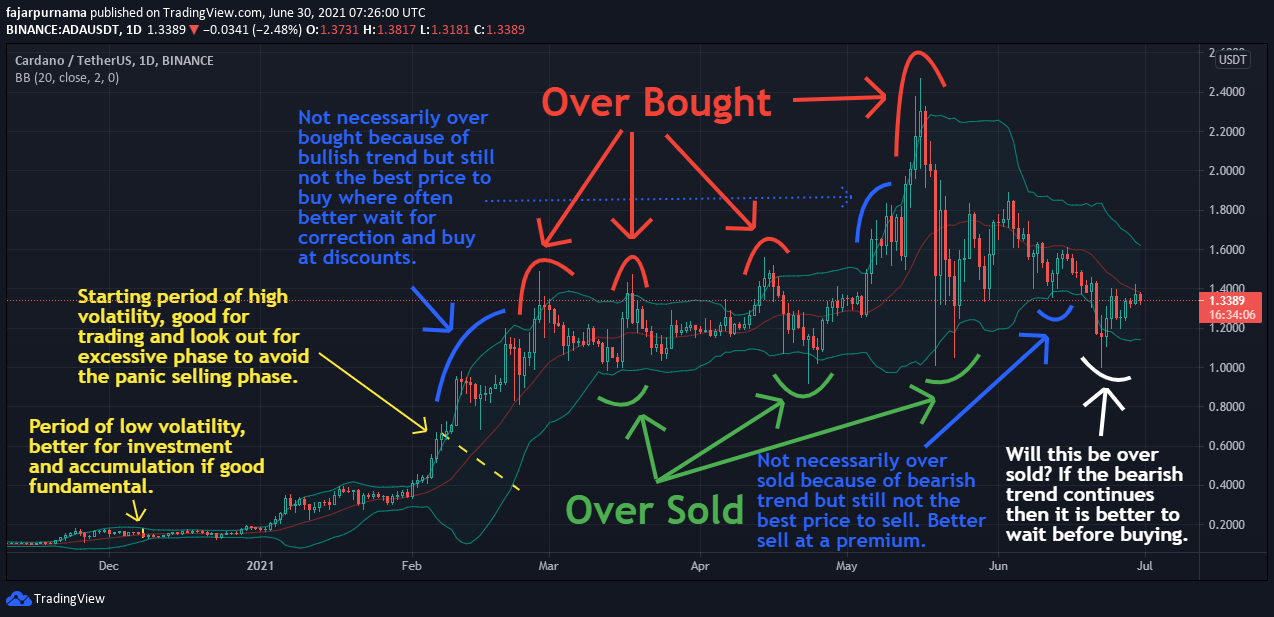
Bollinger Bands were developed by John Bollinger mainly to identify whether an asset is overbought or oversold. For beginner traders, Bollinger bands can indicate 2 things, periods of low and high volatility, and periods of overbought and oversold. When the bands are narrower compared to other periods means periods of low volatility and when the bands are wider means periods of high volatility. When the price nears the lower band, often it is oversold, and when the price nears the higher band, often it is overbought. However, do not forget that indicators are lagging that currently in real time the price nears the upper band but if the trend is bullish, it can still increases. The same when the price nears the lower band that when the trend is bearish, it can still decreases. The calculation of Bollinger band is based on the mathematic:
BOLU = MA(TP,n) + m∗σ[TP,n]
BOLD = MA(TP,n) − m∗σ[TP,n]
where:
BOLU = Upper Bollinger Band
BOLD = Lower Bollinger Band
MA = Moving average
TP: typical price = (High + Low + Close)/3
n = Number of days in smoothing period
m = Number of standard deviations
σ[TP,n] = Standard Deviation over last n periods of TP
Oscillators
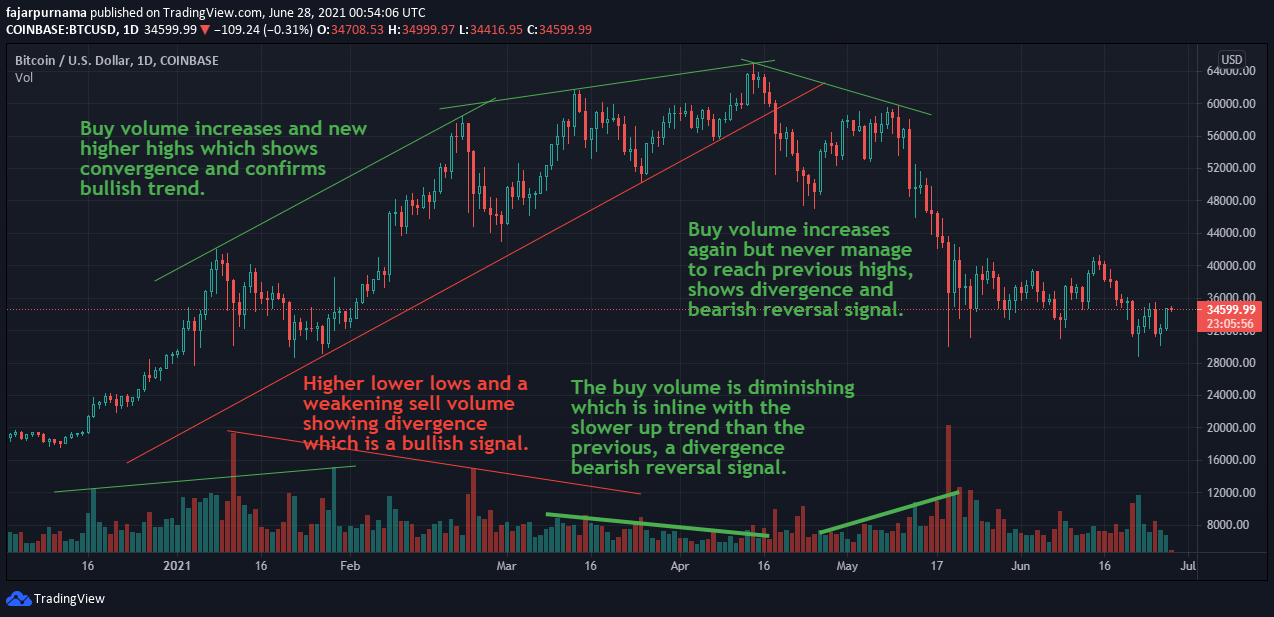
Oscillators are things that produces oscillations which are repetitive variation such as springs and vibrations and in technical indicators are wave forms based on the calculation of trading data. Unlike overlays, they are separated from the price indicator, usually placed on the bottom or on the top. Unless you are comfortable with small screens, multiple oscillators is also not a good idea because it can make things more complicated but aside from multiple monitors as a solution, a larger monitor works as well as these indicators does not stack on the price indicator. Back in the first chapter, there is a DOW Theory that the volume confirms the trend and that volume indicator is an oscillator type. When the price increases near proportional to the volume, we may guess that there are many buying and selling and ultimately the buyers overwhelmed the sellers. But what about a low volume? Maybe just one person crazily made a big buy. Then what happens next? Maybe many sellers will see this as an opportunity to take profit.
Stochastic
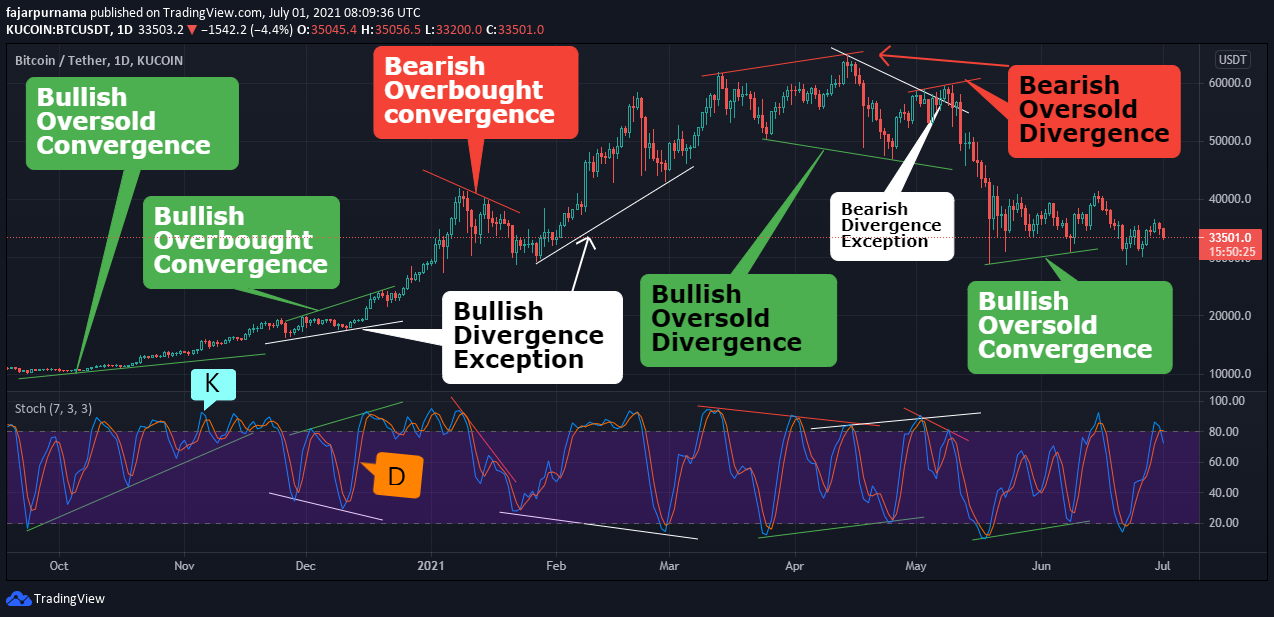
The stochastic oscillator is a momentum oscillator that compares the current price to the previous prices. Like Bollinger Band it is to find whether an asset is overbought or oversold. Other than that, most traders uses this indicator to find convergence and divergence. Convergence means that it is as it should be where a bullish trend means less oversold and more overbought and vice versa where bearish trend means less overbought and more oversold. If the relationship between the indicator and the price is not as it should be, then it is a divergence which have high probability of a reversal. The price reaches a new high but the indicator shows lower overbought means that the buying power is not as expected. Can the buying power be exhausted? If so, expect more selling power incoming. The price reaches a new low but the oversold is not as much as the previous one. Can the selling power be exhausted? If so, expect more buying power incoming. Two exception when the oversold is greater but the price did not go lower may mean that the price cannot go any lower so the only way is up and when the overbought is greater but the price did not go any higher may mean that the price cannot go any higher so the only way is down. There are many other momentum oscillator such as relative strength index (RSI), rate of change, and money flow index (MFI) but the basic utilities are the same where for example stochastic oscillator in Tabtrader are for Pro users only, so just use RSI.
%K = 100 * ((C – L(N)) / (H(N) – L(N))
%K is the derived indicator value
C is the current price point
L is the lowest price point over a specified period
H is the highest price point over a specified period
N is the defined period
%D = (K1 + K2 + K3) / 3
%D is 3 periods moving average of %K values
Even I now I do not understand what stochastic is except for the definition in the dictionary “pertaining to conjecturing” and in Greek dictionary is “to aim at a mark, guess”. I can only guess that it has something to do with random variables. For stochastic oscillator, I decided to look at the formula instead to understand the meaning and I found that it is to find whether the current price is cheap (oversold) or expensive (overbought) compared to the previous price. For example, this week the price ranges from $1 - $10, what does $7 means? It means that the distance between the lowest price is $7 and the distance between $10 is $3, it is the third highest price which some may see it as expensive. Today, a new price appears, $16, which is $15 distance from the lowest price $1 and $6 higher from the highest price $10. After checking the news and found no good enough reason, I will sell, who would be crazy enough to buy something this expensive? Anyway, the K is the stochastic oscillator value and the D is 3 periods moving average of K which is designed to be lagging. Just like golden and death crosses, when the 2 line intersects may signal a change of price direction.
Moving Average Convergence Divergence
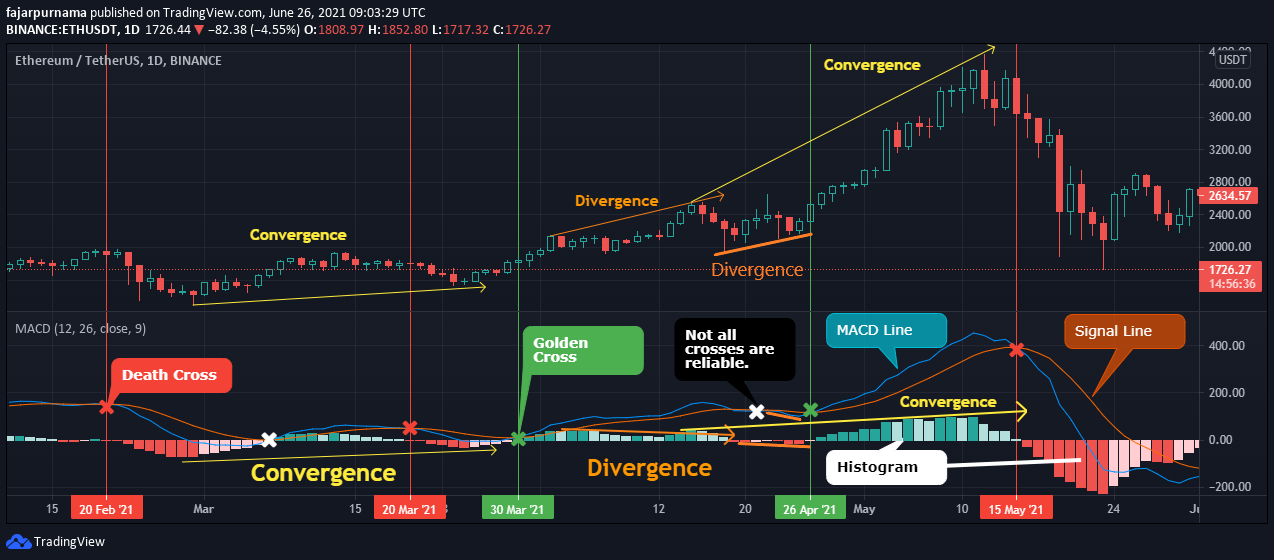
Moving Average Convergence Divergence (MACD) line is a difference between shorter period exponential moving average and longer period moving average usually 12 Period EMA - 26 Period EMA. The signal line is usually 9 days moving average of the MACD line. Like many other indicators, there are golden crosses and death crosses. Like many oscillators as well, the lines can be used to find convergence and divergence (whether the indicator behaves how it should be logically). Before I read about this indicator, I never noticed the lines and only saw the histogram. Even a beginner trader can see that the upper band relates to the buying pressure and the lower relates to the selling pressure even though it is actually the difference between the MACD line and the signal line (histogram = MACD - signal). The golden crosses and the death crosses can be indicated an empty bar on the histogram because of the MACD line and the signal line cancels out each other. Histogram can also be used to find convergence and divergence whether the histogram should behaved how it should be based on the market.
Final Thoughts
Like there are many candle stick patterns, there are many technical indicators. Like in the previous chapter where the popular candle stick patterns are enough to read the basics, the indicators above are enough to do basic technical analysis. Even advance traders does not use a large amount of candle stick pattern and technical indicators but continue their study to chart patterns, fibonacci sequence, harmonic pattern, etc, but ofcourse learning more can improve our analysis skills. I personally prefer honing the basic foundations such as learning all the candle stick patterns and all other indicators than rushing to the next level. Still, indicators are just one of the utilities that we can use in trading that we should not rely 100% on it. For example above, not all golden crosses and death crosses are relevant, not always a sell signal the moment an asset shows overbought and not always buy signal the moment an asset shows oversold, and not always a clear reversal on divergence. Therefore, we should not forget the basics such as drawing swings, trend lines, support & resistance lines, and supply & demand areas.
Mirrors
- https://www.publish0x.com/cryptocurrency-101-for-users/financial-technical-analysis-crypto-narrative-chapter-4-indi-xoolewr?a=4oeEw0Yb0B&tid=github
- https://0darkking0.blogspot.com/2021/07/financial-technical-analysis-crypto.html
- https://0fajarpurnama0.medium.com/financial-technical-analysis-crypto-narrative-chapter-4-indicators-36fa44f7f3f
- https://0fajarpurnama0.github.io/cryptocurrency/2021/06/04/fta-crypto-chapter-4
- https://hicc.cs.kumamoto-u.ac.jp/~fajar/cryptocurrency/fta-crypto-chapter-4
- https://steemit.com/cryptocurrency/@fajar.purnama/financial-technical-analysis-crypto-narrative-chapter-4-indicators?r=fajar.purnama
- https://leofinance.io/@fajar.purnama/financial-technical-analysis-crypto-narrative-chapter-4-indicators?ref=fajar.purnama
- https://blurtter.com/cryptocurrency/@fajar.purnama/financial-technical-analysis-crypto-narrative-chapter-4-indicators?referral=fajar.purnama
- https://0fajarpurnama0.wixsite.com/0fajarpurnama0/post/financial-technical-analysis-crypto-narrative-chapter-4-indicators
- http://0fajarpurnama0.weebly.com/blog/financial-technical-analysis-crypto-narrative-chapter-4-indicators
- https://0fajarpurnama0.cloudaccess.host/index.php/8-cryptocurrency/cryptocurrency-101-for-users/234-financial-technical-analysis-crypto-narrative-chapter-4-indicators
- https://read.cash/@FajarPurnama/financial-technical-analysis-crypto-narrative-chapter-4-indicators-cc15ffe6
- https://trybe.one/financial-technical-analysis-crypto-narrative-chapter-4-indicators
- https://www.floyx.com/article/0fajarpurnama0/financial-technical-analysis-crypto-narrative-chap-000163f2b6
- https://markethive.com/0fajarpurnama0/blog/financialtechnicalanalysiscryptonarrativechapter4indicators