Financial Technical Analysis Crypto Narrative Chapter 1 DOW Theory
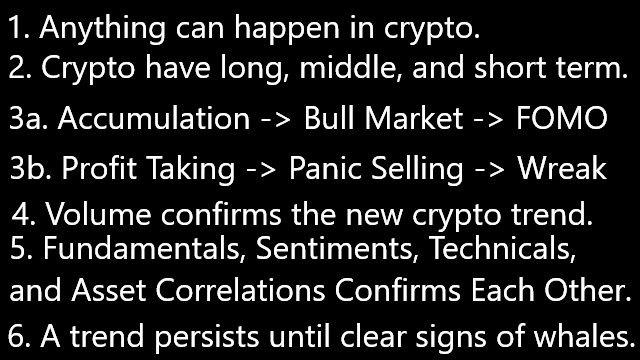
In the current financial technical analysis (FTA), the first subject to learn is the DOW Theory. Sounds similar to DOW Jones right? Well it was written by Charles H. Dow who was the co-founder of Dow Jones and Company. The writer himself never called it the “DOW Theory” as he was just writing pieces of information in The Wall Street Journal where he was the founder in. William Peter Hamilton, Robert Rhea, and E. George Schaefer collected and organized his writings from 255 editorials in The Wall Street Journal and called it the DOW Theory.
If you have been following my blogging income reports, you probably read that I used my profits from the crypto bull market to take a course in financial technical analysis. Since there are already many sources about the Dow Theory such as Wikipedia and Investopedia, I will write mine from a different perspective which are based on my experiences in the cryptocurrency market and my financial technical analysis course. There are six main headlines of the DOW Theory:
1. The Market Discounts Everything
The market incorporates every single piece of information in real-time. It is almost humanely impossible to catch up in real-time. So there are “no absolutely right” and “no absolutely wrong”, but there are “most likely” and “less likely”.
- The market discounts everything.
- The market went the opposite of our analysis.
- There are probably information that we left out so go back to rule number that the market discounts everything and readjust our analysis.
To relate this to crypto it is always best to quickly change our tune. An investor does not follow Bitcoin Maximalist who are always bullish in Bitcoin. Always bullish is good for early investors but for new investors, it is stupid to buy at a high price. It is safer to wait for a pull back, correction, or the bear market rather than buying high and panic selling later. Investors must realize that they are not purely investors, they are supporters who will live and die for Bitcoin. For analyzers, the market is the king, not Bitcoin. If you want to take a god, do not take Bitcoin as a god, but take the market as the god. On the other side, always bearish like Peter Schiff and listening to central bankers always saying that crypto have no value and pure speculations is not good either. I do believe that the crypto market is highly speculative as most people went in only to hope for profit in the future. However, only “highly” and I believe there are values such cheaper cross border transaction, transparent ledger, cannot be confiscated, cannot be censored, decentralized finance, and all other innovations in financial technology (fintech). When Bitcoin reached $1000, Peter Schiff was right to call it a bubble, but when it dropped, it was not wise to stay bearish. The fact that it went up to $20000, he was right again to call it a top and dropped to $3000 but do you stay bearish again? Wrong! the next top is $60000! Following Peter Schiff is good for preserving your wealth by converting your assets to gold and silver but for average people will never break through the rich boundaries if you just follow him. If you ignored him and went in to crypto early, you have been rich. Even I earned 10 years worth of average salaries in just half a year. If you are a trader and always listens to Bitcoin Maxis or Peter Schiff, you should stop calling yourself a trader.
2. The Chart Have 3 Main Scales
Micro Scale
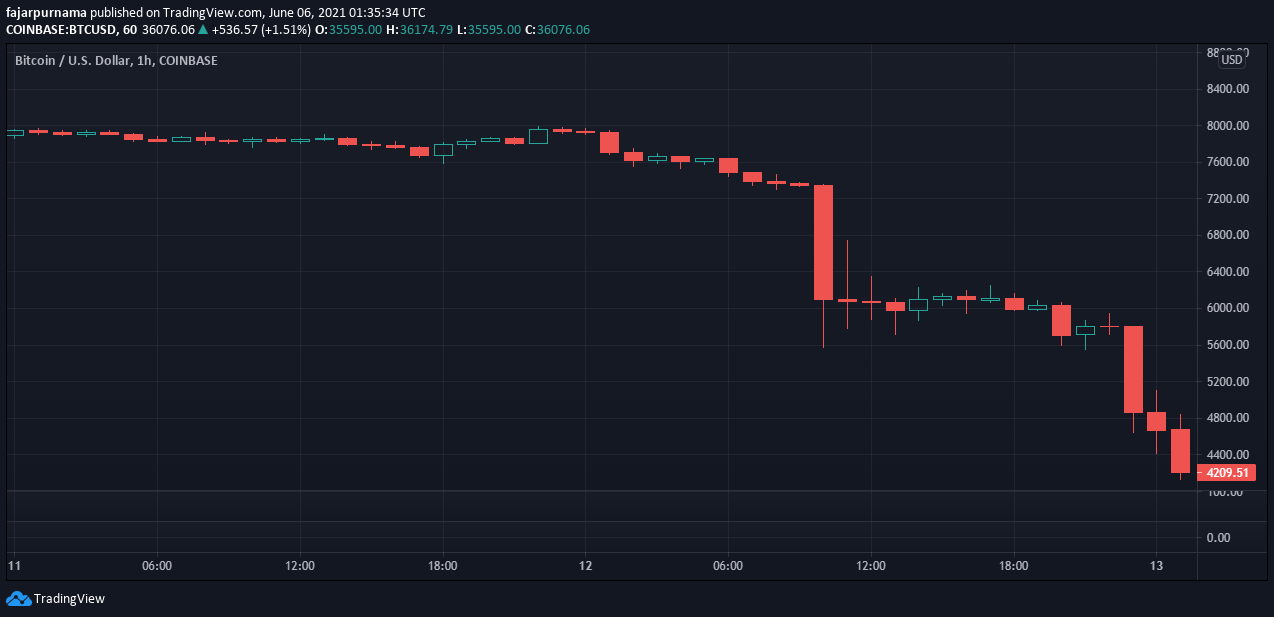
Take a look at 12 March 2020 which seemed like Bitcoin is going to die.
Macro Scale
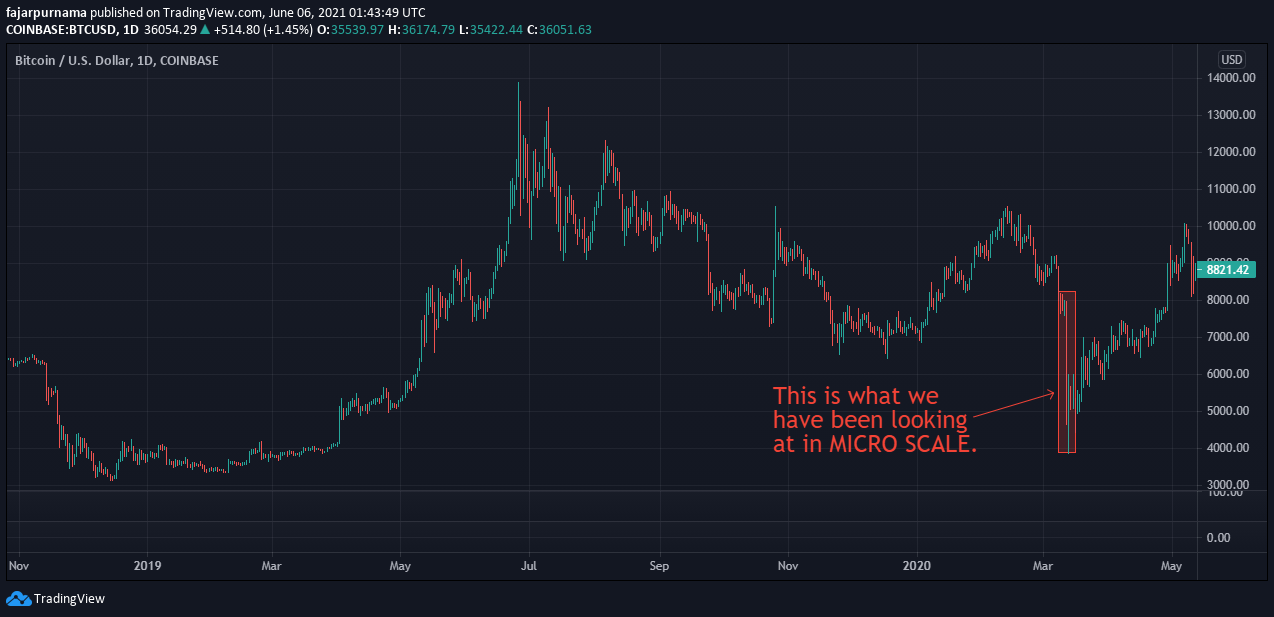
If we zoom out, it is just a cycle and nothing dramatic.
Full Scale
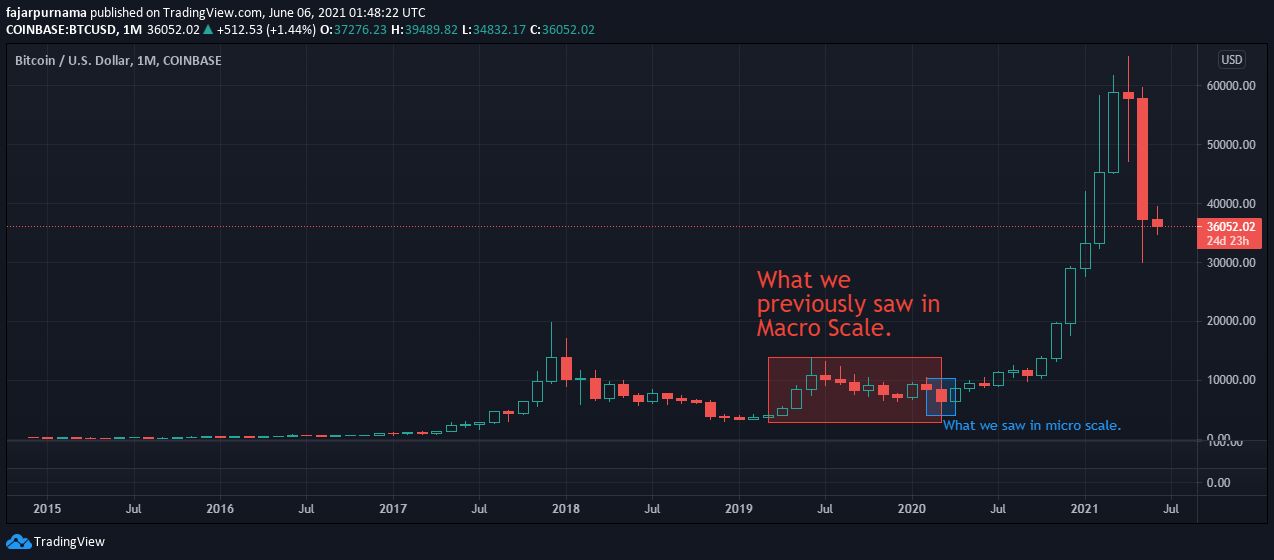
The great price crash in March 2020 due to COVID Pandemic seems insignificant in the grand schemes of things.
Order of Analysis
I wrote the narrative the opposite of how we supposed to analyze in order to emphasize the importance of looking at the bigger picture. Not looking at the bigger picture is also the cause of people getting destroyed by fear of missing out (FOMO). When looking at the bigger picture, people should be cautious when Bitcoin pumps, but instead did not take profit and let greed took over them, resulted in them panic selling when the price crashed. Ofcourse, they will cry more when the price recovers. Although the best time to trade is during the FOMO but the best time to invest is during the calm before the storm and by zooming out to the bigger picture, we can better guess when it is a calm and when it is a storm.
Looking at the bigger picture applies every where not just in finance. When we want to read a book, we first look at the cover, the title, then its summary before reading the contents. In an article, we read the headings first, then the images, then finally the contents. In education, we learn the overview in primary school and highschool, then choose a field in undergraduate school, and finally specialized in graduate school. We ourselves are living in a world, in a planet called Earth, Earth have many countries, countries have many provinces, and provinces have many cities. There are numerous examples and the order for financial technical analysis is:
- Look at the full scale usually above weekly charts.
- Zoom to the macro scale usually daily charts.
- Finally zoom to the micro scale which are hourly and minute chart.
3. Each Scale have 3 Trends and 2 Trends have 3 Phases
The 3 Trends
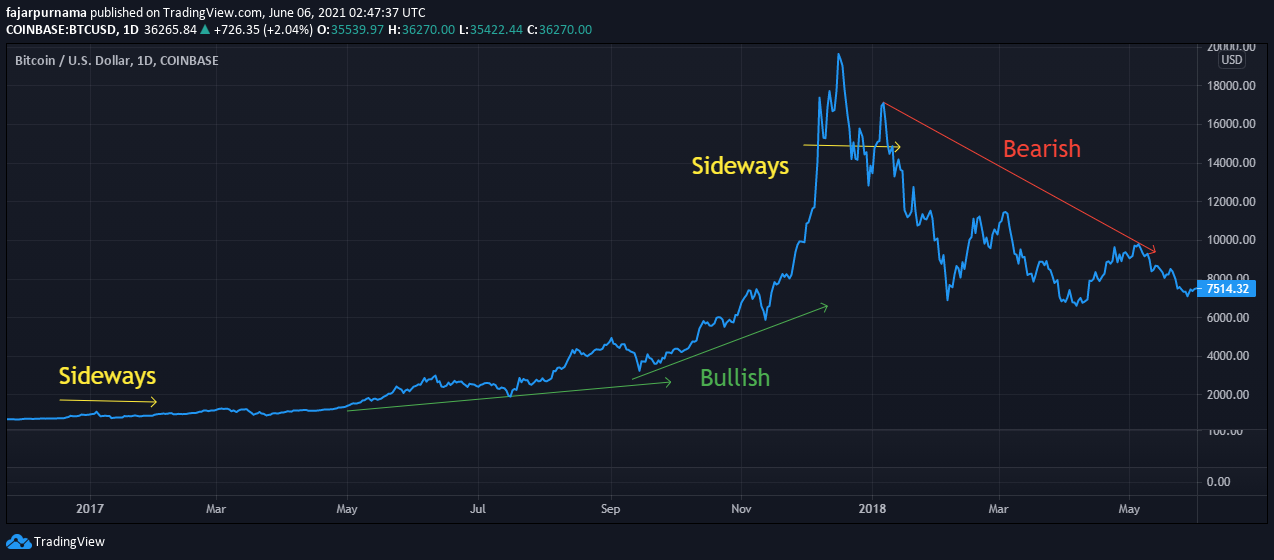
- Bullish means a bull charging up where the price is going to an upper direction.
- Bearish means a bear slamming down where the price is going to a lower direction.
- Sideways means the overall price is not going up nor down.
The 3 Phases in 2 Trends
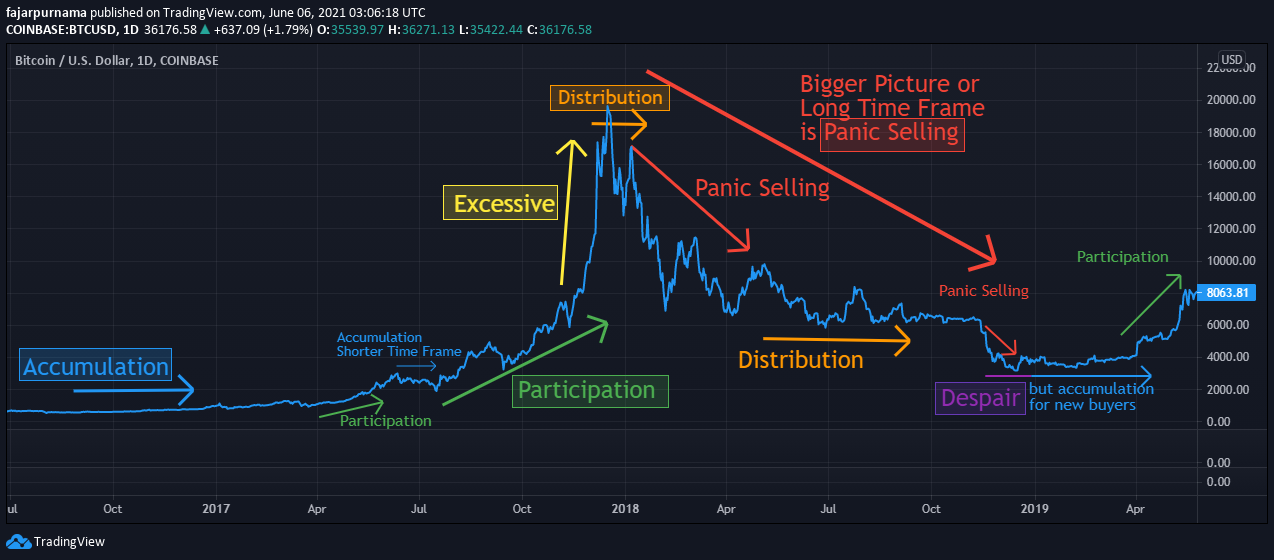
Bullish Trend
- Accumulation is a sideway phase before going up where early investors are buying and accumulating in this phase. This is boring times in the market where less people are interested and as I said before, investors invests during the calm before the storm.
- Participation means more people are starting to hear about the asset and are interested in participating. In 2021, when Elon Musk and other influencer started to tweet about cryptocurrency, their followers became curious, and then became interested in buying. For traders, this is the phase to become active as price starts to fluctuates.
- Excessive is a phase more related to fear of missing out (FOMO). Relatives and friends starting to hear that people are getting rich with cryptocurrency and they do not want to be left out. Most decided to buy and gamble without doing their own research. Finally when distant relatives and friends who never contacted you before contacted you asking about cryptocurrency is a strong indication that it is the end of the excessive phase. This is especially true if finally your grandparents asked you about crypto as well.
Bearish Trend
- Distribution phase is where finally many news broadcast about cryptocurrency because the price greatly rose. Everybody is in the game. Who else is left to buy to drive the price up further?
- Panic Selling is a phase where there is no longer new buyers driving the price up and buyers especially early ones started to take profit driving the price down. New buyers and investors suddenly at loss or almost at loss. They began to panic as the price keeps going down afraid of losing their investment and started selling. The price kept falling down and more of them started to panic.
- Despair is a phase where there is finally no more panic sellers. The ones left are either true supporters of the asset, users or more to utilizers of the assets who bought not to invest but to use, or those who are late in panic selling and are in despair as selling at this point will not make much difference. Though the future can change the classification of this phase. If the price drops again, this phase will change name into distribution phase, and on the other hand if the price rises, this phase becomes accumulation phase for new buyers.
4. Volume Confirms The Trend
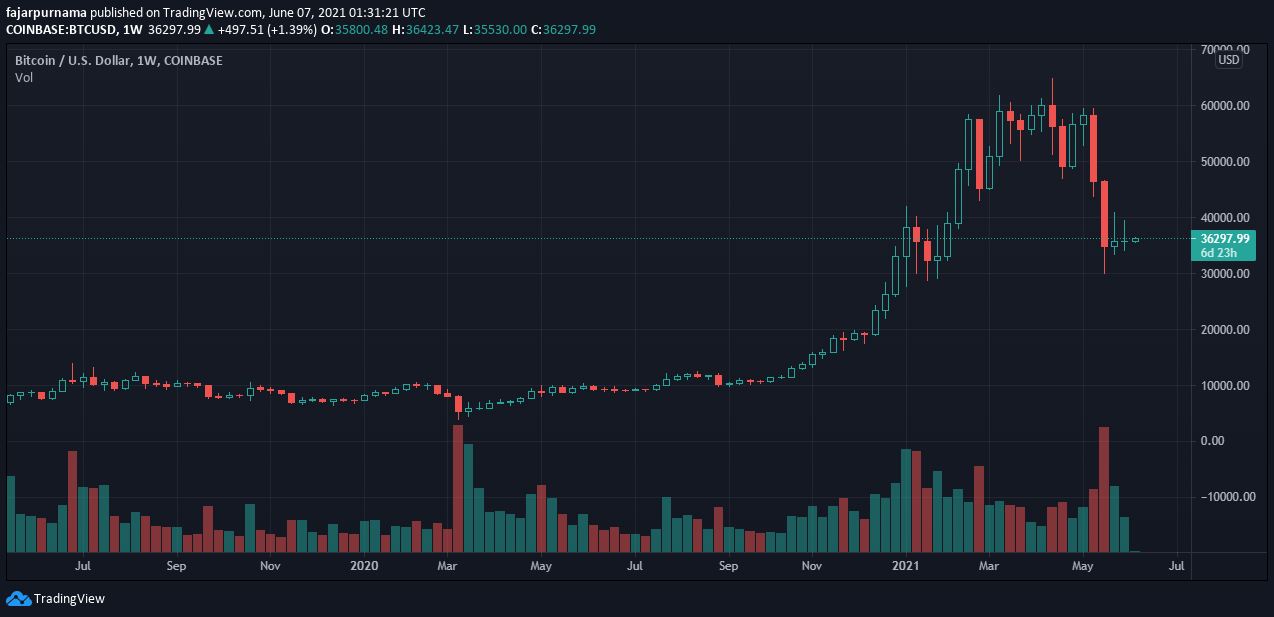
A higher volume suggests that a trend is most likely to continue. On the other hand when the price moves when there is small volume, the theory suggests that we should be careful of reversals. Although, mnay traders I knew prefers to use indicators such as relative strength index (RSI), stochastic, and moving average convergence divergence (MACD) as a replacement of volume indicator. Maybe in the past there were no modern indicators and traders relies on volume.
5. Market Confirms Each Other
Here I am using Crypto Watch to see correlations between crypto assets. It is popular today when Bitcoin is up, the whole crypto market is up, and so does the reverse. Although, I find it safer to use the top coins as an indicator or better of the majority of the market if possible. If the top coins goes down, there is a high possibility that other coins will follow. If you are eyeing on a coin, it is better to wait until it goes down as well before buying. On the other hand, if the coin you are eyeing does not go down, it tends to go up instead where bases on my experience, something special is happening with the coin.
In my opinion, one the reason why the whole crypto market is correlated to Bitcoin when the price rises is because there are still many people who are not into crypto. For new people, Bitcoin is the first thing they learn. It is very rare for someone new to know about random coin first before Bitcoin. After they are into Bitcoin, then they will see that there are other cryptocurrencies. In short, Bitcoin is currently the corner stone for new people. They buy Bitcoin first, then they buy other coins which is why when Bitcoin rises, other coins tends to rise.
As for when Bitcoin price is down, is related with everyone trying to buy top coins with cheaper price. When Bitcoin is down, traders tends to take profit on other coins and wait and see how far Bitcoin price can go down before buying. In short, most people in crypto are interested in many coins, not just one which is why when top coins goes down, people in other coins will sell as well because they see an opportunity get in more into top coins.
As for token ecosystem they are the same. For UNI, LINK, and SUSHI, if Ethereum goes up, then these coins tends to go up because in order to buy those tokens we need Ethereum. For CAKE, BAKE, BANANA, etc we need BNB to buy them. For PNG, YTS, and SNOW we need AVAX.
DOGE coin is becoming less correlated with the crypto market because it moves based on influencers such as the TikTok movement to make DOGE $1 and Elon Musk, Snoop Dog, Gene Simons, and Dallas Mavericks adopting DOGE. Gold and Silver is becoming less correlated both to the US Dollar and the crypto market which is a good diversification option. Finally, there is no such thing as buying crypto and US Dollar at the same time as they are negatively correlated.
Other than correlating one indice with another and one asset with another, is to correlate information in our analysis. When our technical analysis shown to be bullish and a buy signal, we should confirm with the fundamentals whether the project delivers good product or not, the road map whether they deliver on time or not, the news whether it is interesting or not, and the sentiment whether people are happy or angry. If most of them are positive, then is a strong convergence correlation that it is mostly safe to buy. However, if they are negative which is in divergence, there is a chance of reversal so be careful where it is best to do nothing if we are not sure. For example, the news is bullish but the price does not move. Investors will get disappointed and will sell.
6. Trend Persist Until Clear Reversal
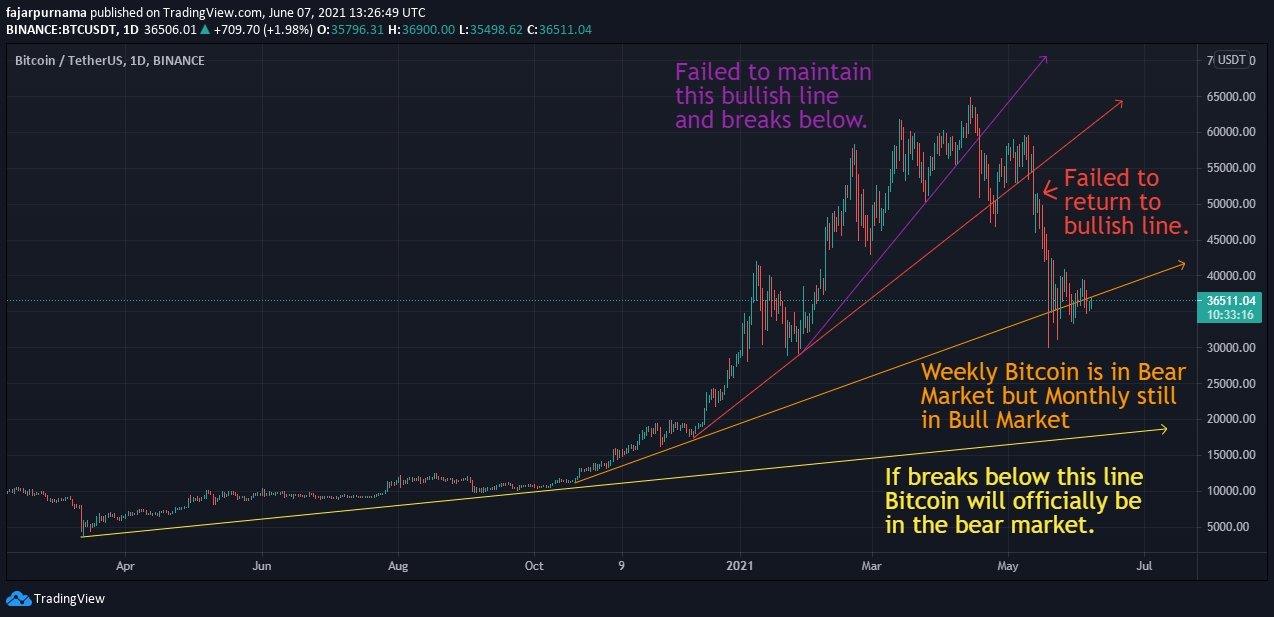
There are many noises in the short time frame. There are many ups and downs in the middle time frame. However, there is always a trend line in the long time frame. For as long as the trend line is not broken, the trend persists. For people who entered Bitcoin in February 2021, the bullish trend was broken in April 2021 as it failed to maintain $60000. For people who entered Bitcoin in New Years Eve 2021, the bullish trend was broken in May 2021 as it failed to maintain $55000. For people who entered during the DeFi hype in October 2020 are now in a critical moment whether the price can maintain $37000. For people who entered earlier are still in a bullish trend until it breaks below $20000. This can be why chain analysis showed that the people who panic sold are the newcomers because from their perspective the trend is bearish. However, for early people like me, chain analysis showed that most of us have not sold as we are still in profit and for us is still bullish.
Recommendation
The DOW Theory is helpful everywhere, not just stocks, cryptos, and foreign exchanges. It is helpful even in commodities, business, and for merchants. New traders probably did not know there is the DOW Theory and went straight to identifying supports and resistances, and drawing trend lines. A serious financial technical analyzer memorizes the DOW Theory, understands the meaning behind, and always be mindful of the Theory in every analysis. In other words, DOW Theory is first before doing any kind of drawings. For example, look at the bigger picture first and guess the phase that we are in. Second, check whether the trend is persisting or not and see whether the volume confirms so. Third, do not forget to look at the news, check people’s sentiments, and see other correlated information as well. For example, we do not want to be buy/long on gold and Bitcoin when the United States Dollar is recovering. Instead, it is better to long on US stocks. Even before that, the fundamentals is more important where at least we should know what we are investing or trading in. You can try asking new traders about what Ethereum, Binance Smart Chain, and Polygon is. Probably most of them cannot answer. If they can, the answer is most likely that MATIC greatly rose and they made profit buying MATIC. If you are that kind of people, that is find, it takes time to read the fundamentals and you may most likely miss the trading if you read the fundamentals first. However, do not be like that forever because it increases the chance of you getting wreak. When you are asked what MATIC is, at least you should answer that it is a second layer of Ethereum providing much cheaper fees for decentralized finance (DeFi). That is a much better answer even it is not too accurate. Finally, when the market goes the opposite of your prediction, do not blame the market because DOW Theory number 1 that the market discounts everything and probably you missed some information. It is your analysis that is wrong, not the market. Discounts “everything” is literally “everything”, even Elon Musk’s Tweet.
Mirrors
- https://www.publish0x.com/cryptocurrency-101-for-users/financial-technical-analysis-crypto-narrative-chapter-1-dow-xelyrkz?a=4oeEw0Yb0B&tid=github
- https://0darkking0.blogspot.com/2021/06/financial-technical-analysis-crypto.html
- https://0fajarpurnama0.medium.com/financial-technical-analysis-crypto-narrative-chapter-1-dow-theory-469586e14330
- https://0fajarpurnama0.github.io/cryptocurrency/2021/06/01/fta-crypto-chapter-1
- https://hicc.cs.kumamoto-u.ac.jp/~fajar/cryptocurrency/fta-crypto-chapter-1
- https://steemit.com/cryptocurrency/@fajar.purnama/financial-technical-analysis-crypto-narrative-chapter-1-dow-theory?r=fajar.purnama
- https://leofinance.io/@fajar.purnama/financial-technical-analysis-crypto-narrative-chapter-1-dow-theory?ref=fajar.purnama
- https://blurtter.com/cryptocurrency/@fajar.purnama/financial-technical-analysis-crypto-narrative-chapter-1-dow-theory?referral=fajar.purnama
- https://0fajarpurnama0.wixsite.com/0fajarpurnama0/post/financial-technical-analysis-crypto-narrative-chapter-1-dow-theory
- http://0fajarpurnama0.weebly.com/blog/financial-technical-analysis-crypto-narrative-chapter-1-dow-theory
- https://0fajarpurnama0.cloudaccess.host/index.php/8-cryptocurrency/cryptocurrency-101-for-users/231-financial-technical-analysis-crypto-narrative-chapter-1-dow-theory
- https://read.cash/@FajarPurnama/financial-technical-analysis-crypto-narrative-chapter-1-dow-theory-bc51702a
- https://trybe.one/financial-technical-analysis-crypto-narrative-chapter-1-dow-theory
- https://www.floyx.com/article/0fajarpurnama0/financial-technical-analysis-crypto-narrative-chap-00016ca759
- https://markethive.com/0fajarpurnama0/blog/financialtechnicalanalysiscryptonarrativechapter1dowtheory
