Financial Technical Analysis Crypto Narrative Chapter 6 Fibonacci Golden Ratios
Get 1000000 0FP0EXP Token to remove widget entirely!
Get 500000 0FP0EXP Token to remove my NFTS advertisements!
It is stated in many investing and trading articles that Fibonacci golden ratios are used to find hidden supports and resistances. The most frequently used Fibonacci tools in trading are Fibonacci retracement and extension or expansion. Fibonacci retracement is used to predict how much a corrective phase will or the term most cryptocurrency supporters, how far will the dip be. Fibonacci extension is used to predict how low the bottom will be and on the other side, how high the top will be. Before directly discussing Fibonacci golden ratios for financial technical analysis, we will summarize the theory behind Fibonacci golden ratios.
The Fibonacci Numbers

In mathematic, Fibonacci are magic numbers. In natural science, Fibonacci numbers appears very frequently such as the number of leaves in plants and the number of petals in flowers as stated in Laura Resta’s thesis in biomathematics entitled The Fibonacci sequence in phyllotaxis. We can see the above image of 1,2,3,5,8,13 where the sequence are based on the sum of the previous two numbers (3=1+2, 5=2+3, 8=3+5, 13=8+5) founded by Leonardo Fibonacci. Now that I learned Fibonacci sequences, I no longer use 20, 50, 100, and 200 days when using moving average technical indicator, I used the numbers from the Fibonacci sequence now which are 21, 34, 55, 89, 144, 233, and 377 days moving average.
The Fibonacci Golden Ratios
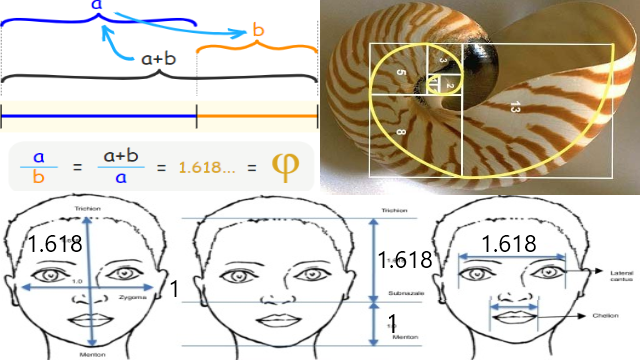
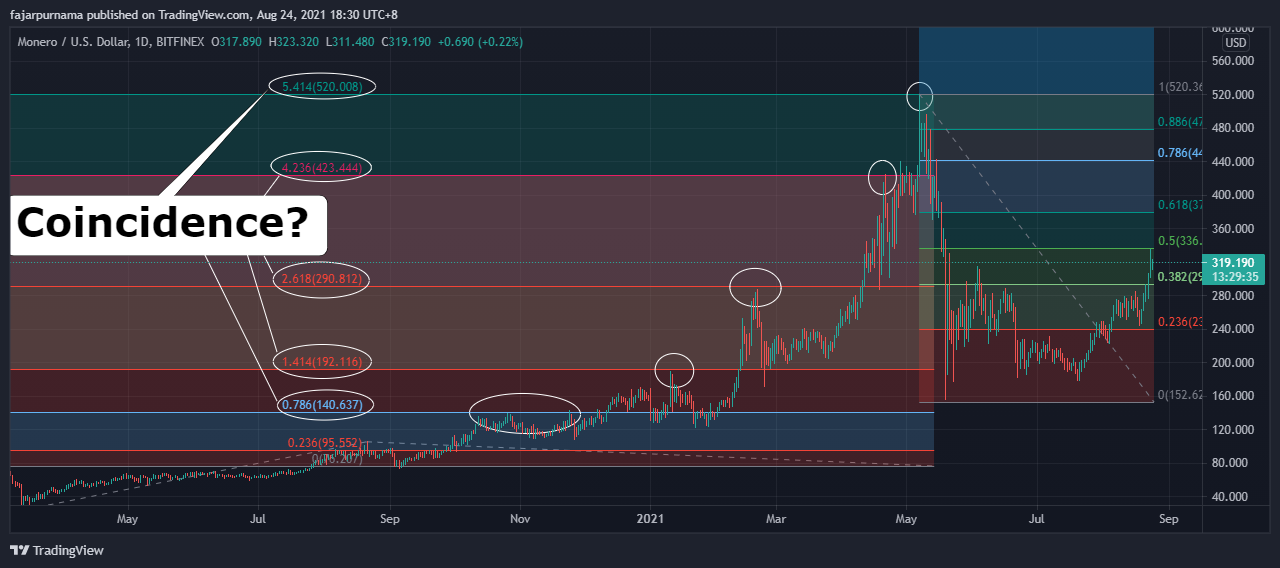
Even as I was taking my trading course, I did not know the concept behind Fibonacci golden ratios. I only have to memorize these numbers 23.6%, 38.2%, 61.8%, 78.6%, 100%, 161.8%, 261.8%, and 423.6%. Now that I am writing this chapter, I have to dig in some background about these golden ratios. The most popular golden ratio is 61.8% (0.618) and 161.8% (1.618) where they can be found in flowers, shells, other natures, and even our faces. The images above are from Kaya KS, Türk B, Cankaya M, Seyhun N, Coşkun BU. Assessment of facial analysis measurements by golden proportion. Braz J Otorhinolaryngol. 2019;85:494–501, Math is Fun Golden Ratio, and Golden Ratio Products. 1.618 is closely obtained from Fibonacci the number added the next sequence it divided by the next sequence (x(i)+x(i+1))/x(i+1) and will be the golden ratio if x(i+1)/x(i) equals 1.618. For example (233 + 377) / 377 = 1.618 and 377 / 233 = 1.618. 0.618 is really just the reverse x(i+1)/(x(i)+x(i+1)) = x(i)/x(i+1) for example 377 / (233 + 377) = 233 / 377 = 0.618. For other golden ratios, just change the sequence, for example x(i+2)/(x(i)+x(i+2)) = x(i)/x(i+2) such as 377 / (144 + 377) = 144 / 377 = 0.382. Since this is a technical analysis chapter and not mathematic chapter, the theory stops here. All we need to know that these are also frequently appeared numbers in finance just like they frequently appeared in nature. For example myself, when I am waiting for dip, I am interested in a correction of 23%, 38%, 50%, 61%, and 78%.
Popular Fibonacci Trading Tools
There are two mostly used Fibonacci trading tools, even many professional traders only needs to use these and I myself never used other tools before writing this chapter. They are Fibonacci Retracement and Fibonacci Extension or Expansion. Other Fibonacci tools are optional.
Fibonacci Retracement
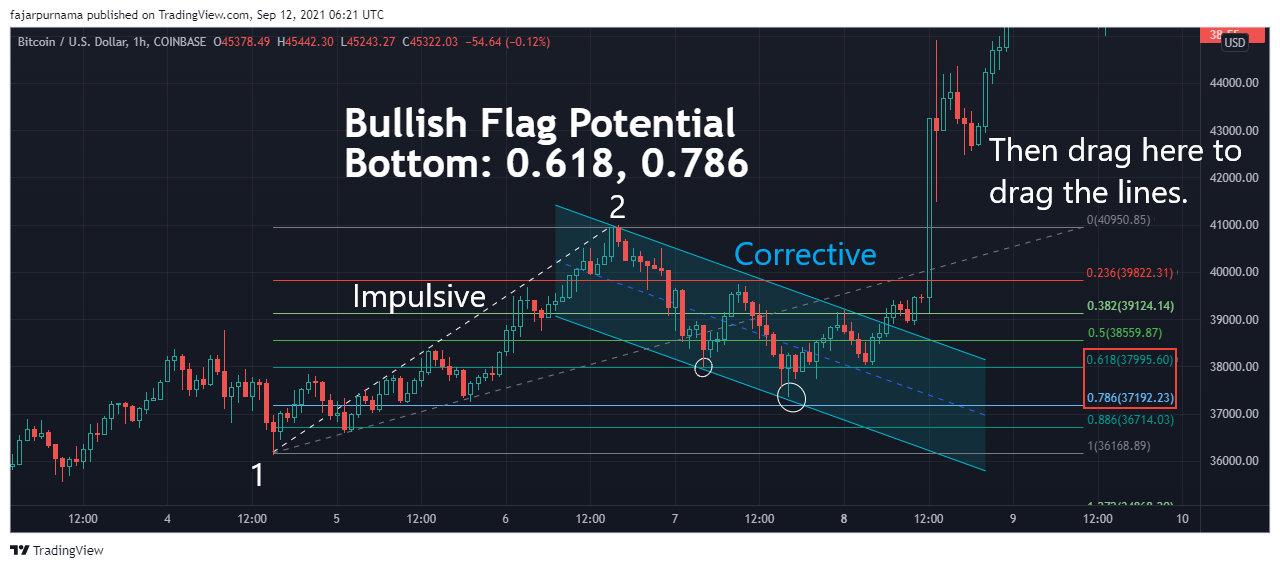
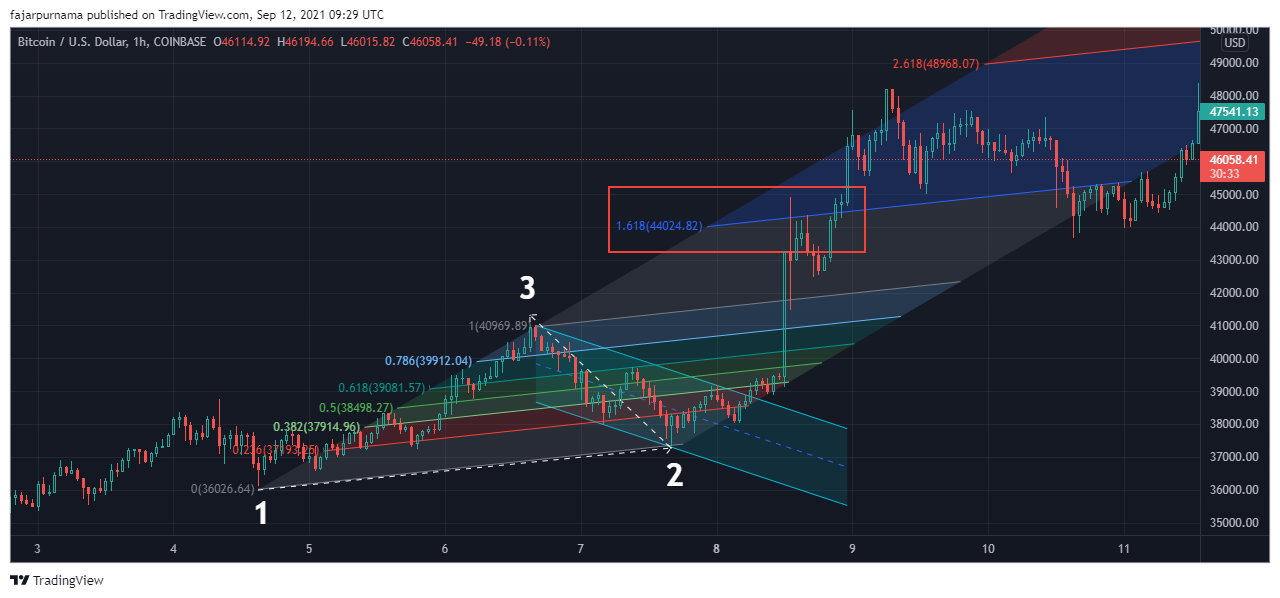
Fibonacci Retracement is used to predict correction depth before continuing the trend whether bullish or bearish. For example in previous chapter about classic chart pattern, we can identify a bullish flag. We can apply Fibonacci Retracement and predict the potential bottom of the bullish flag. To apply Fibonnaci Retracement here, pull a line from the bottom of the impulsive phase to the top (before the corrective phase). If the trend is bearish, then pull a line from top to bottom. The chart example above shows a bullish flag found in Bitcoin chart and seems the correction depth almost reached 78.6%. Some traders place an all in buy order below 61.8% and some investors place a dollar cost average (DCA) order or buy the dip on those magic numbers, usually 38%, 50%, 61%, and 78%.
Fibonacci Extension or Expansion
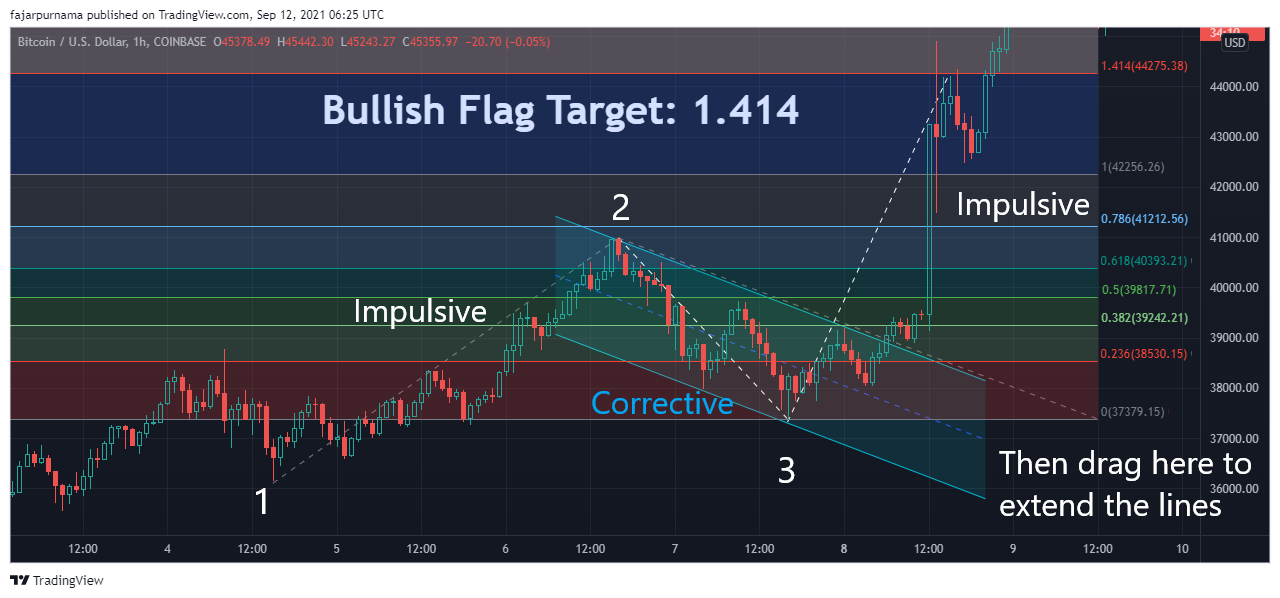
In trading view the tool is Fibonacci Extension while in Metatrader is Fibonacci Expansion. After predicting the depth of the correction or the dip, Fibonacci Extension is applied to predict the length of the trend or the target price. This is mostly used by traders to predict a price to take profit. To draw a Fibonacci extension, first pull a line of the impulsive phase, then pull a line of the corrective phase. Continuing the previous bullish flag chart pattern example, we can estimate the target price to take profit and it seems to be on 141.4%.
Other Fibonacci Trading Tools
I will be honest again that before writing this chapter, I never used the following tools. Fibonacci Retracement and Extension are enough, plus those are the only available Fibonacci tools in Metatrader. The following tools are found in trading view and less likely to be found on other platforms.
Fibonacci Channel
To draw a Fibonacci Channel, first draw a trend line. Second, pull a line to the top that is between the trend line. Third, estimate potential support and resistance.
Fibonacci Time Zone
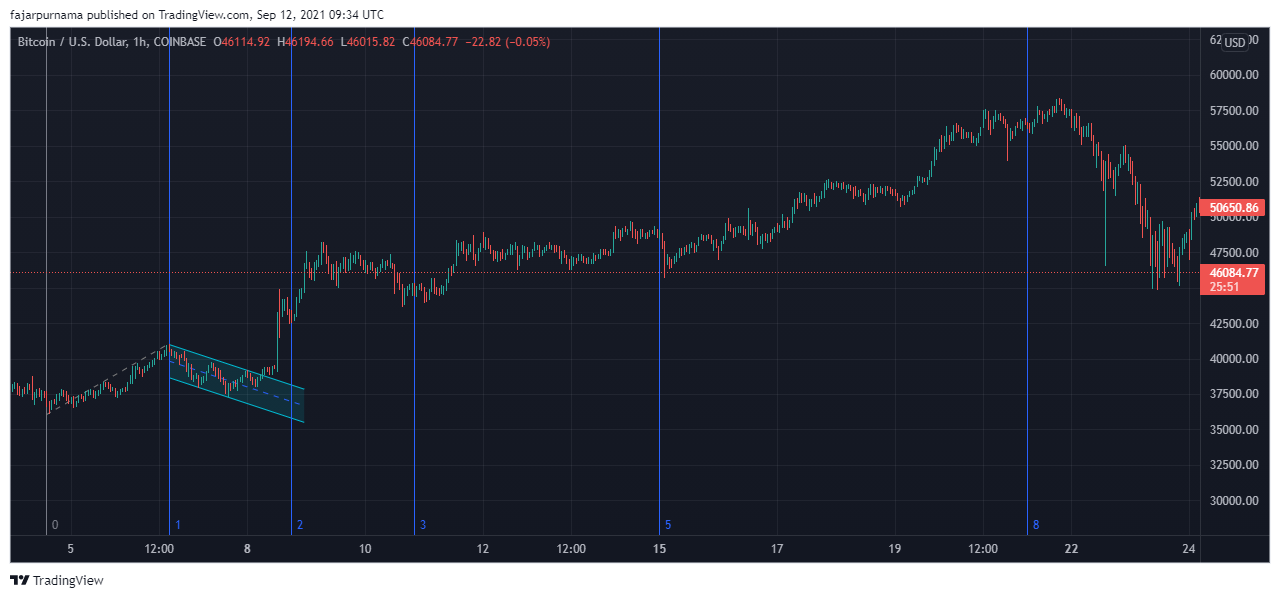
To draw a Fibonacci Time Zone, pull a swing in any phase. Here, I pulled a swing on an impulsive phase before the bullish flag corrective phase. This is to predict times of significant changes, give it a try in any phase and see which one makes sense.
Fibonacci Speed Resistance Fan
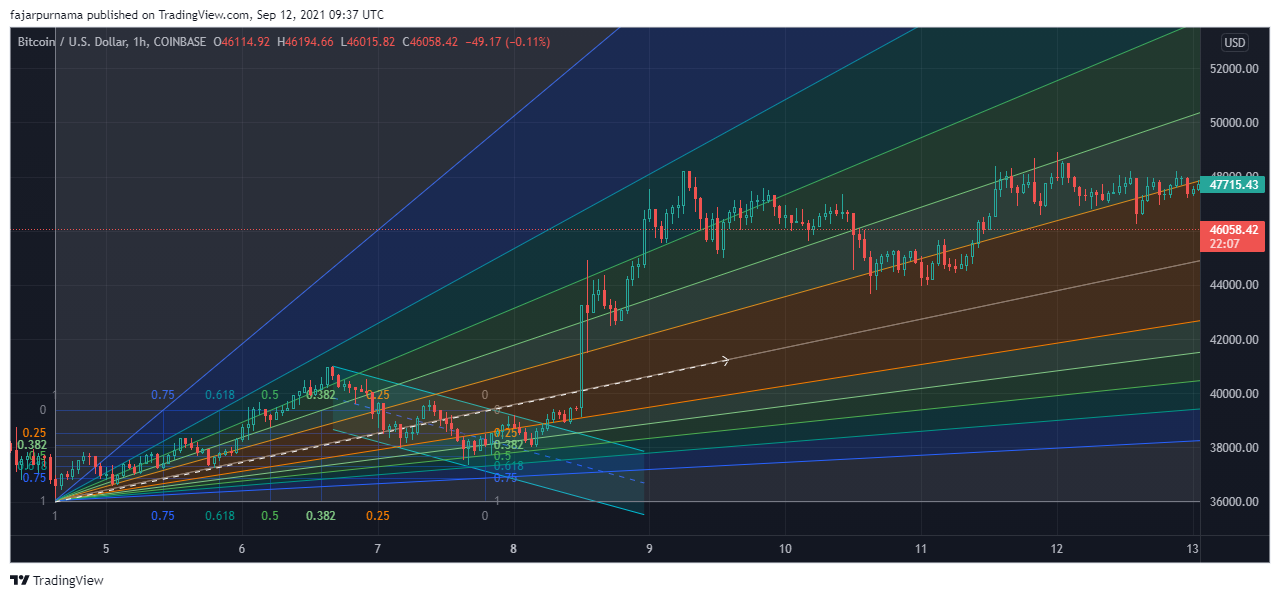
To draw a Fibonacci Speed Resistance Fan, pull a trend line. A general trend line can be pulled by connecting the two lowest or highest points or can be pulled on an impulsive phase. A trend line is very rarely pulled on a corrective phase.
Fibonacci Trend Based Time Zone
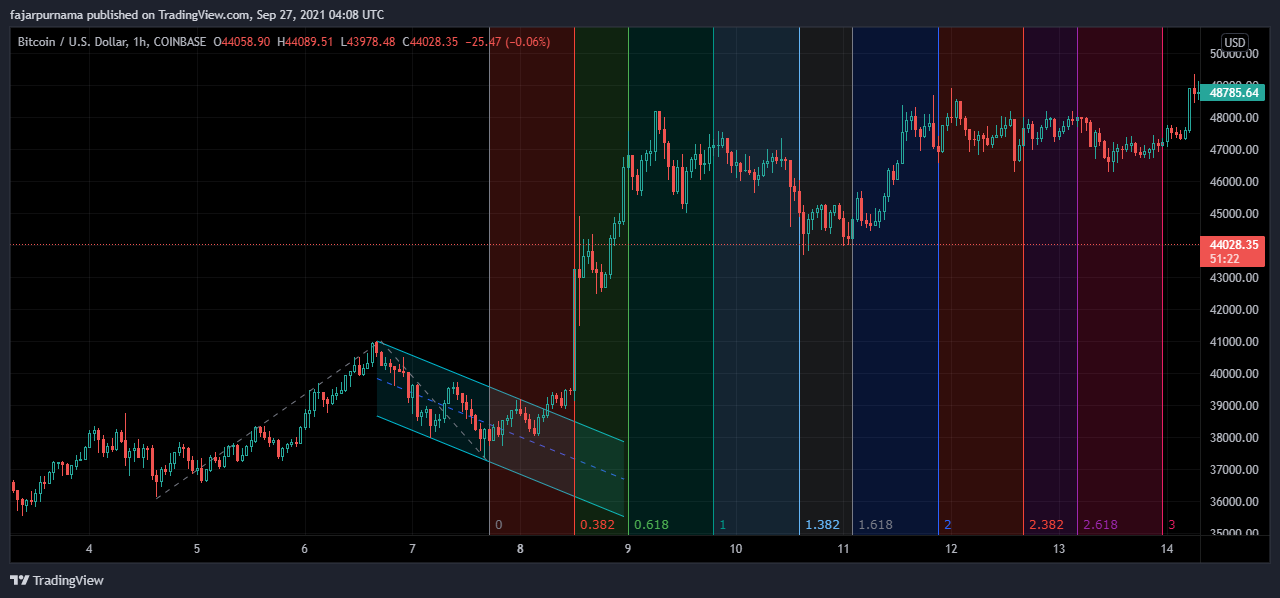
This tool is like the extension version Fibonacci Time Zone.
Fibonacci Circle
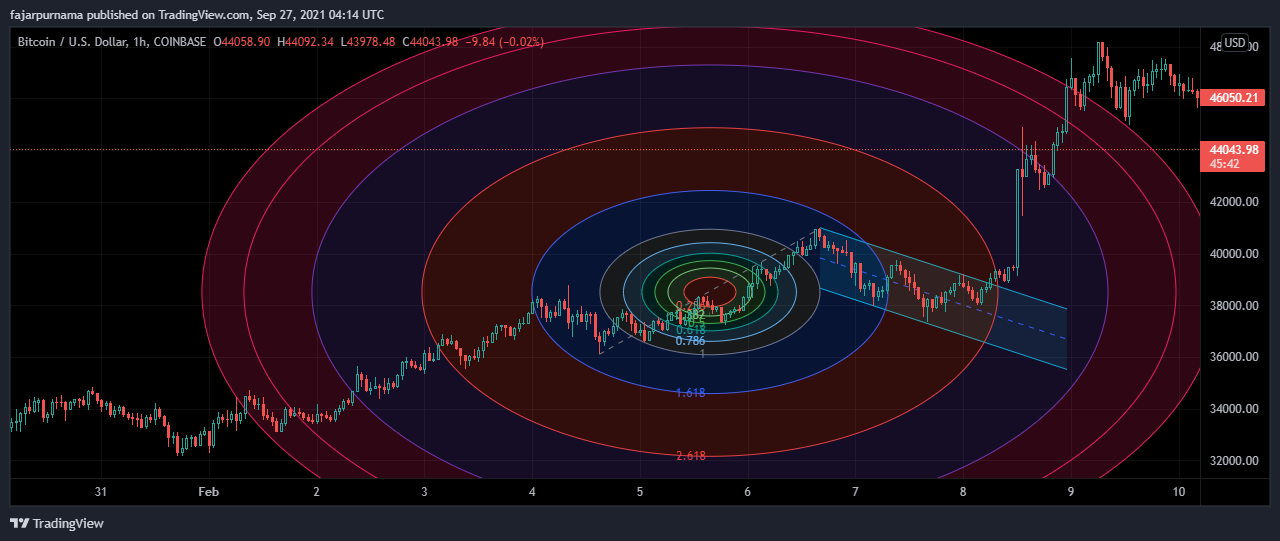
To draw a Fibonacci Circle, draw a swing.
Fibonacci Speed Resistance Arc
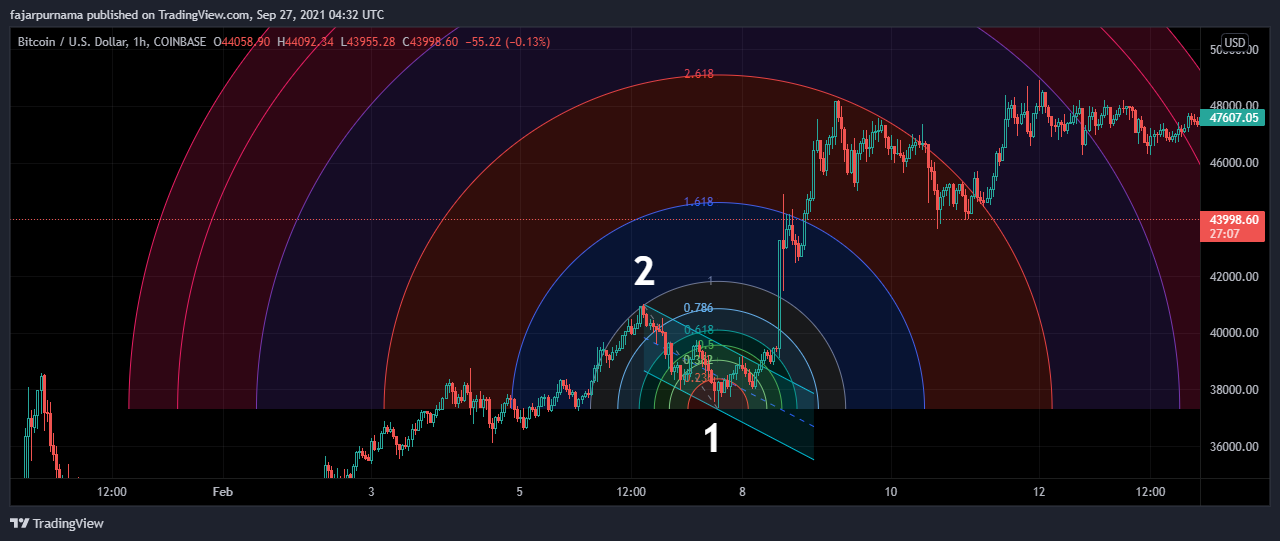
Most article I read wrote to pull a reverse swing to draw this line and the strange thing is that the radius are adjustable by zooming in and zooming out.
Fibonacci Wedge
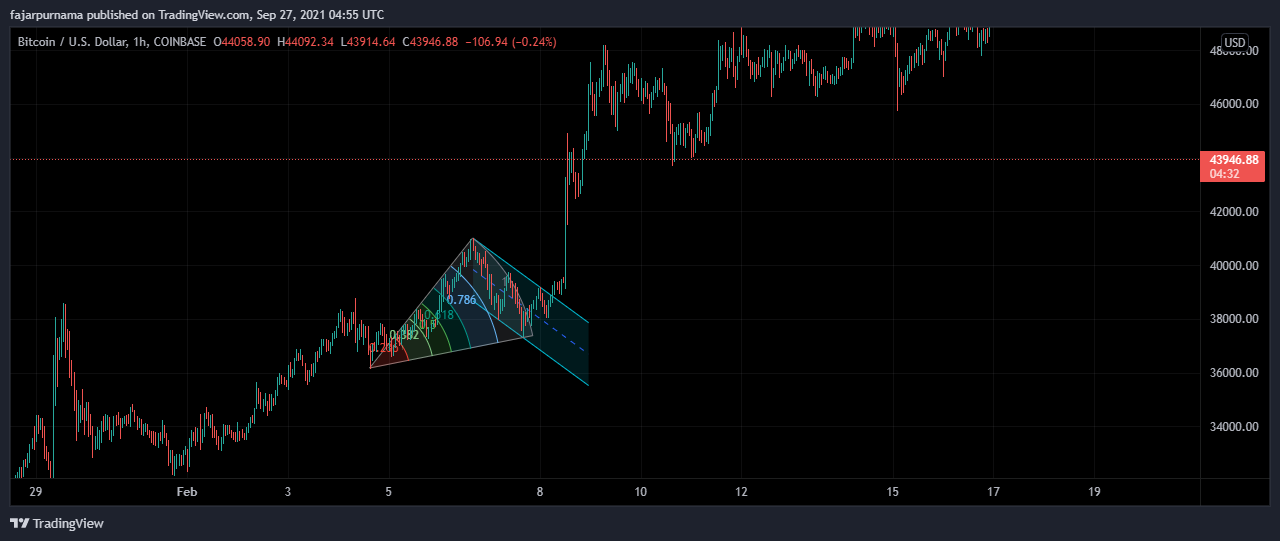
The description of this tool is to estimate the end of a corrective phase but really I do not know how to use this.
Fibonacci Spiral
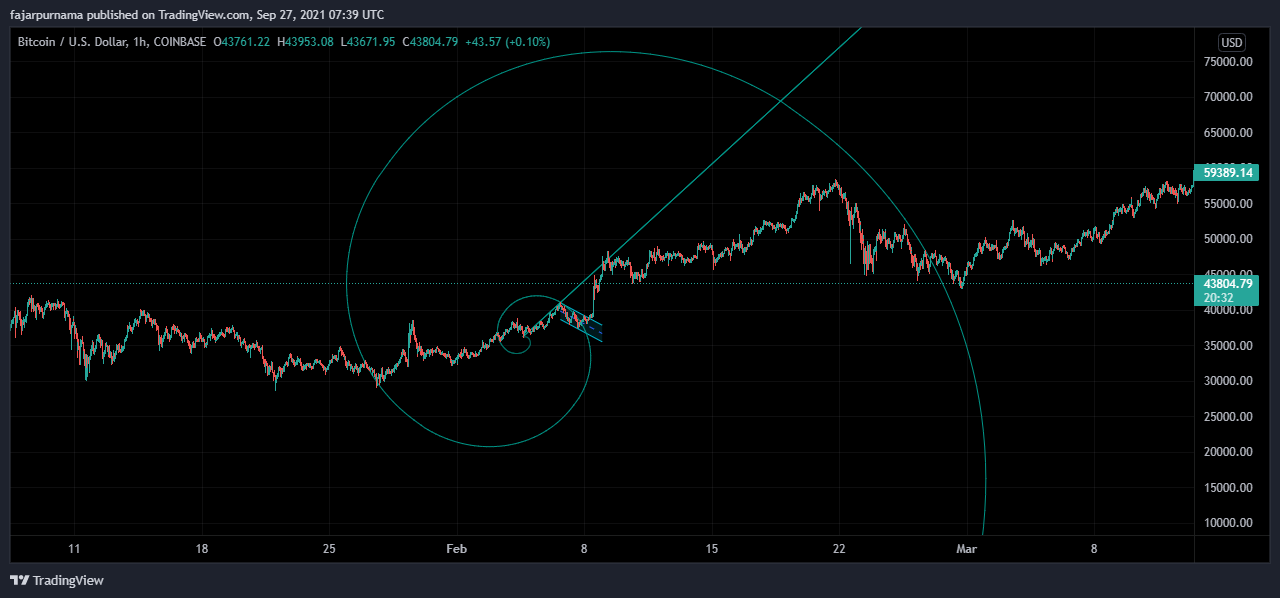
This one I really do not know.
Time To Correct Basic Swings
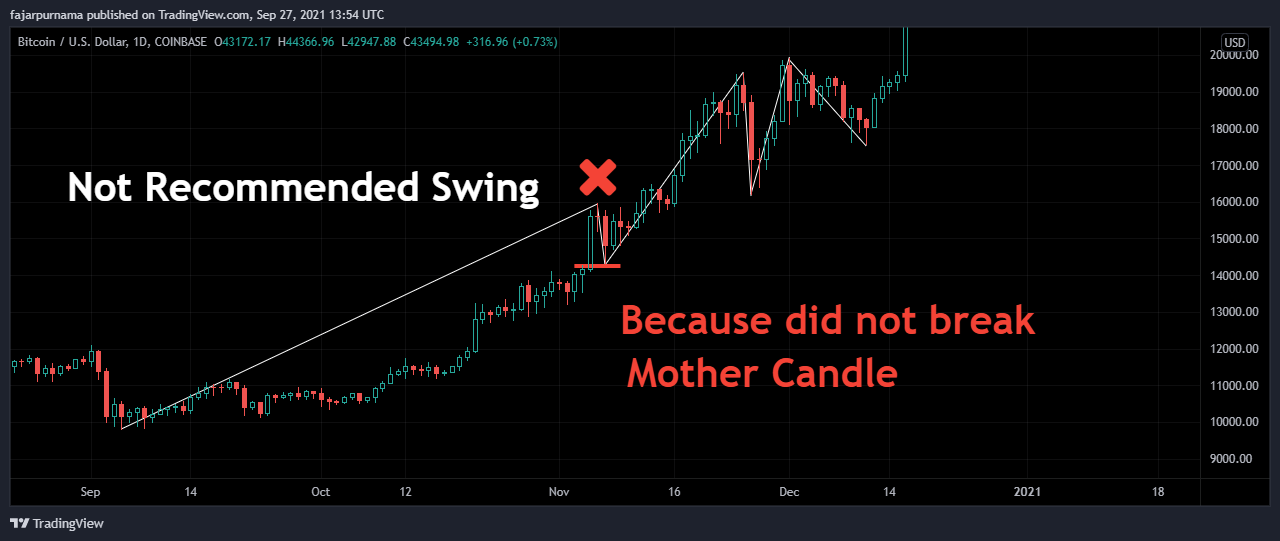
Through out the basic chapters, we have been lax with the swings for as long as they are comfortable for us to analyze. However, we can no longer be tolerable when we reached the Fibonacci chapter. One of the factors that determines the accuracy of Fibonacci trading tools is how accurate we draw a swing. This time, keep in mind that a swing that does not break the mother candle is not recommended.
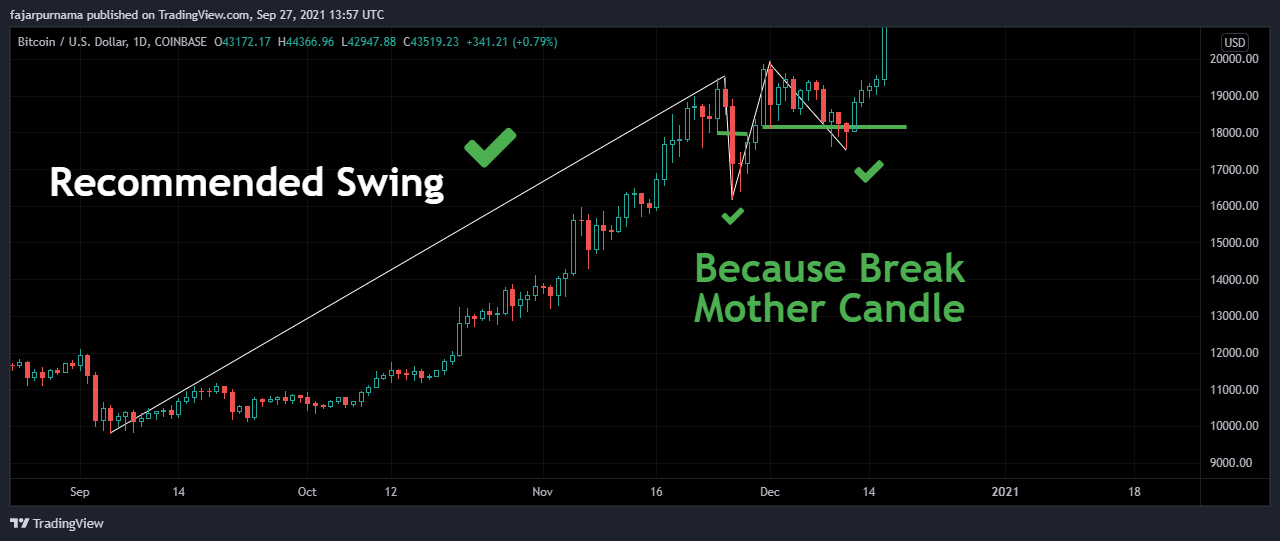
A recommended swing is a swing that breaks the mother candle. It is still okay to skip the swing though. While frequent narrow swings can be better for basic technical analysis but wider swings are safer for drawing Fibonacci lines for example pulling the line from the bottom to the top and vice versa.
Mirrors
- https://www.publish0x.com/cryptocurrency-101-for-users/financial-technical-analysis-crypto-narrative-chapter-6-fibo-xmmxovv?a=4oeEw0Yb0B&tid=github
- https://0darkking0.blogspot.com/2021/11/financial-technical-analysis-crypto_8.html
- https://0fajarpurnama0.medium.com/financial-technical-analysis-crypto-narrative-chapter-6-fibonacci-golden-ratios-ff57e36ecb2b
- https://0fajarpurnama0.github.io/cryptocurrency/2021/06/10/fta-crypto-chapter-6
- https://hicc.cs.kumamoto-u.ac.jp/~fajar/cryptocurrency/fta-crypto-chapter-6
- https://steemit.com/cryptocurrency/@fajar.purnama/financial-technical-analysis-crypto-narrative-chapter-6-fibonacci-golden-ratios?r=fajar.purnama
- https://leofinance.io/@fajar.purnama/financial-technical-analysis-crypto-narrative-chapter-6-fibonacci-golden-ratios?ref=fajar.purnama
- https://blurt.blog/cryptocurrency/@fajar.purnama/financial-technical-analysis-crypto-narrative-chapter-6-fibonacci-golden-ratios?referral=fajar.purnama
- https://0fajarpurnama0.wixsite.com/0fajarpurnama0/post/financial-technical-analysis-crypto-narrative-chapter-6-fibonacci-golden-ratios
- http://0fajarpurnama0.weebly.com/blog/financial-technical-analysis-crypto-narrative-chapter-6-fibonacci-golden-ratios
- https://read.cash/@FajarPurnama/financial-technical-analysis-crypto-narrative-chapter-6-fibonacci-golden-ratios-8d78d4e4
- https://www.loop.markets/financial-technical-analysis-crypto-narrative-chapter-6-fibonacci-golden-ratios/
- https://www.floyx.com/article/0fajarpurnama0/financial-technical-analysis-crypto-narrative-chap-000163f2b6
- https://markethive.com/0fajarpurnama0/blog/financialtechnicalanalysiscryptonarrativechapter6fibonaccigoldenratios