Financial Technical Analysis Crypto Narrative Chapter 5 Classic Chart Pattern
Get 1000000 0FP0EXP Token to remove widget entirely!
Get 500000 0FP0EXP Token to remove my NFTS advertisements!
Almost every traders, investors, and anyone else following crypto in social media and entertainment channels know about classic chart pattern. That is because chart patterns are the easiest to represent, which is the most interesting and entertaining way to share technical analysis to the public. Classic chart patterns also appears in crypto. While many articles probably mentions only 5 to 6 classic chart patterns, this article will mention 20 popular classic chart patterns that are used by intermediate traders.
Reversal Patterns
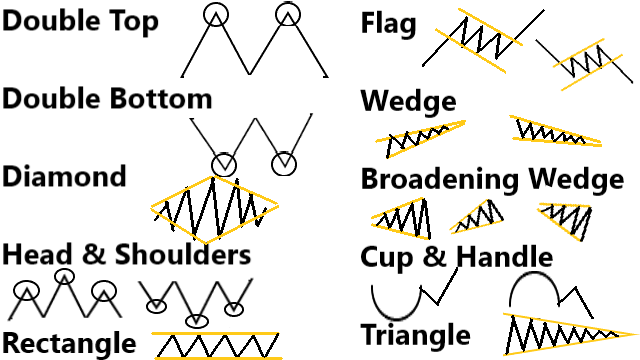
Reversal classic chart pattern are pattern that reverses the trend where if currently the trend is bullish then the trend will reverse to bearish and vice versa. In many articles, these patterns are not the first on the list but I decided to list them here first because new traders when starting their technical analysis education usually forgets about these patterns. The cause is the default instinct of starting learners where they always draw trend lines whenever trying to spot a chart pattern. The fact is that most these popular reversal patterns are not identified by trend lines but by support and resistance lines. Therefore, engrave these patterns into your head first.
Double and Triple Bottoms
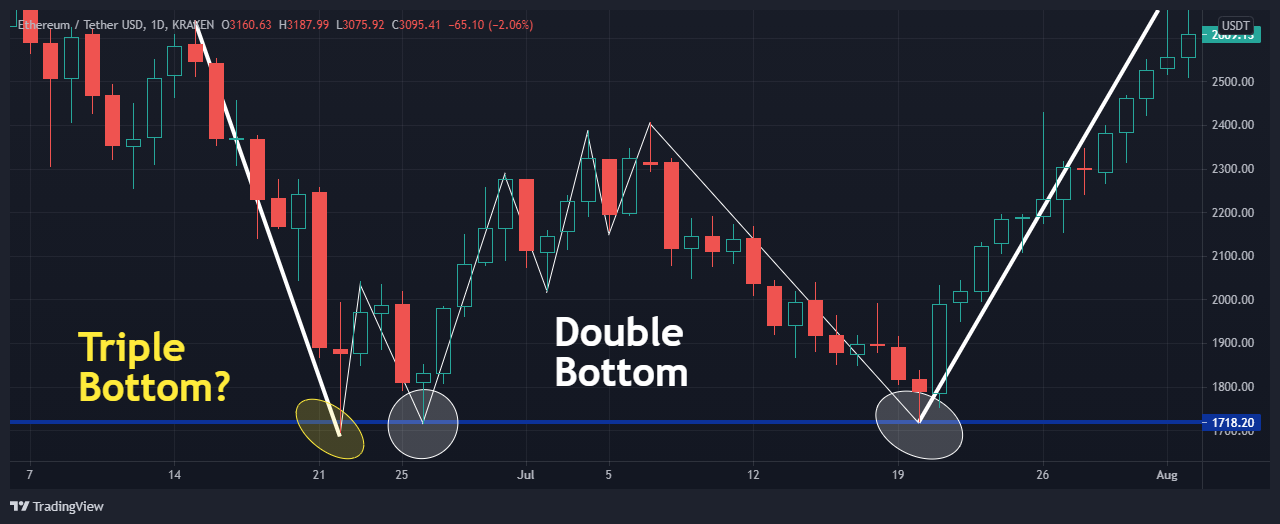
To spot double and triple bottoms, check the support line. Then, check the swings which should look similar to a “W” letter. The price action must once go near the support line, then bounce up and bounce back down. At this point is a potential double bottom and around this time we should enter. Once the price goes up again and surpasses the previous top, then the double bottom is formed. If it breaks far below the support line, then the pattern fails.
Double and Triple Tops
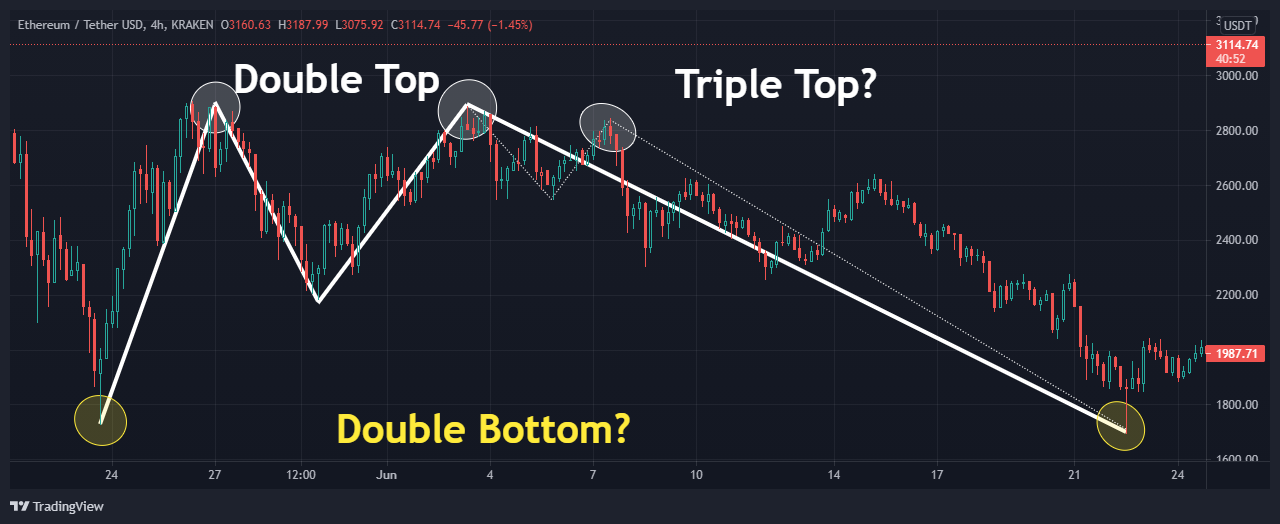
To spot double and triple tops, check the resistance line. Then, check the swings which should look similar to an “M” letter. The price action must once go near the resistance line, then bounce down and bounce back up. At this point is a potential double top and around this time we should enter. Once the price goes sown again and surpasses the previous bottom, then the double top is formed. If it breaks far above the resistance line, then the pattern fails.
Diamond
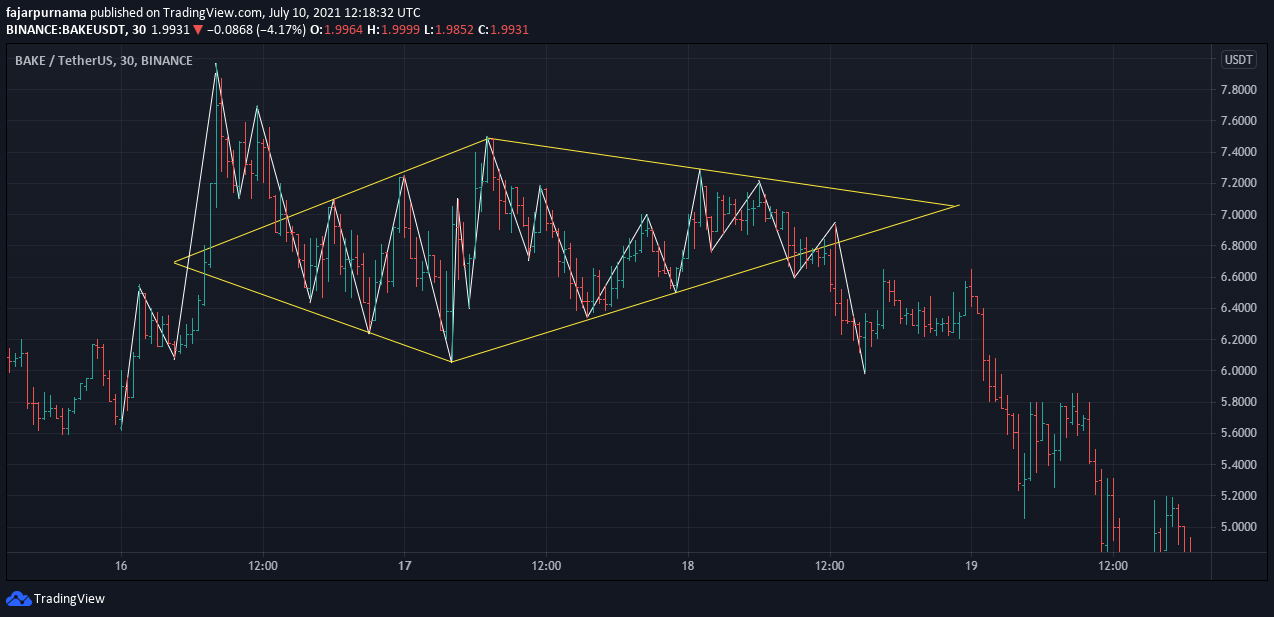
Unlike other reversal patterns, the method of spotting is to draw lower and upper trend lines. Initially, the pattern expands potentially a broadening wedge pattern. However, the next pattern does not continue to expand but contracts instead like a symmetrical triangle pattern. Finally, a reversal occurs and the diamond pattern is complete.
Head and Shoulders
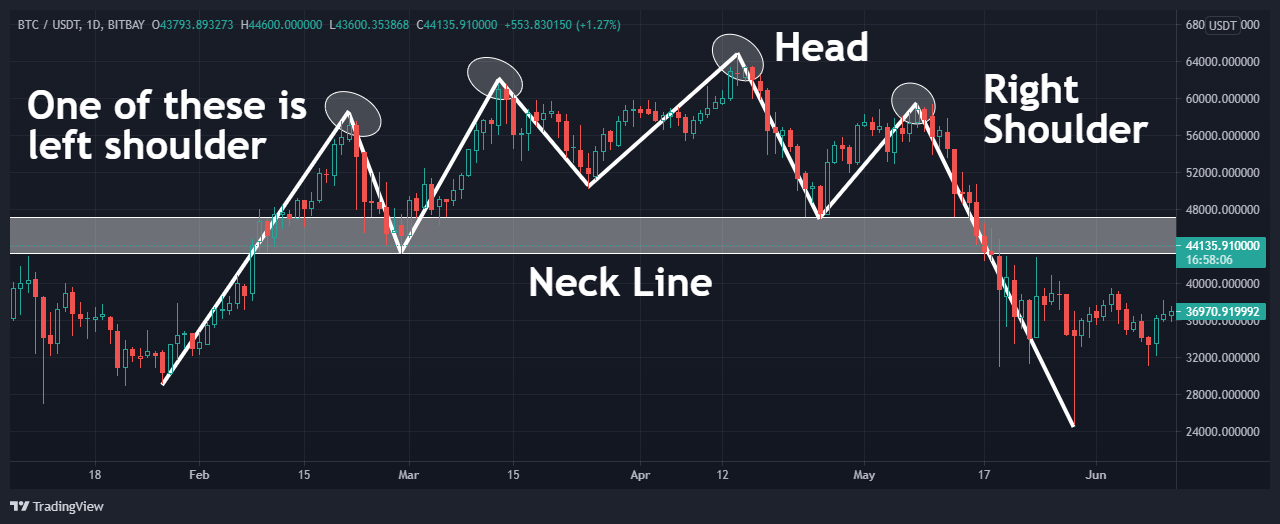
To spot a head and shoulders is to check the supply area. The swings should form 3 mountains where the middle mountain is the highest which is the head, and the other 2 should be the shoulders. When the last swing breaks far below the previous wells, then the head and shoulder pattern is complete.
Reverse Head and Shoulders
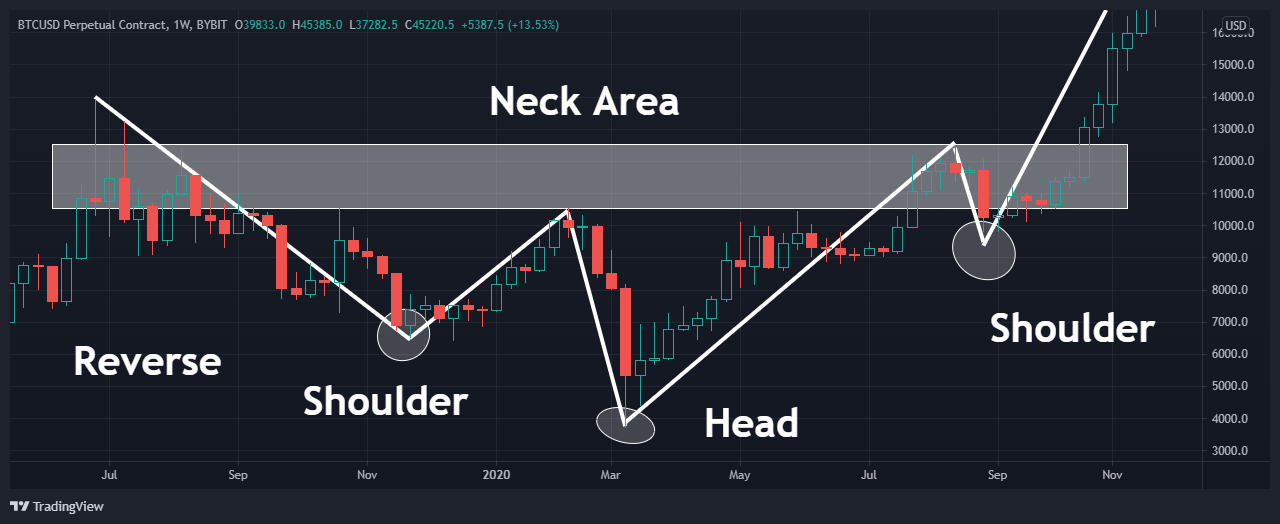
Head and shoulders can be reversed. Instead of 3 mountains, there are 3 wells. While the head and shoulders are bearish patterns, the reverse head and shoulders are bullish patterns.
Continuous Patterns
Continuous classic chart patterns are patterns that continues the trend. After a corrective phase ended, the trend continues and popular classic chart patterns are usually found in these corrective phase. To find these types of patterns, draw a lower and an upper trend line on the corrective phase except for cup and handle pattern which should be identified using support and resistance line.
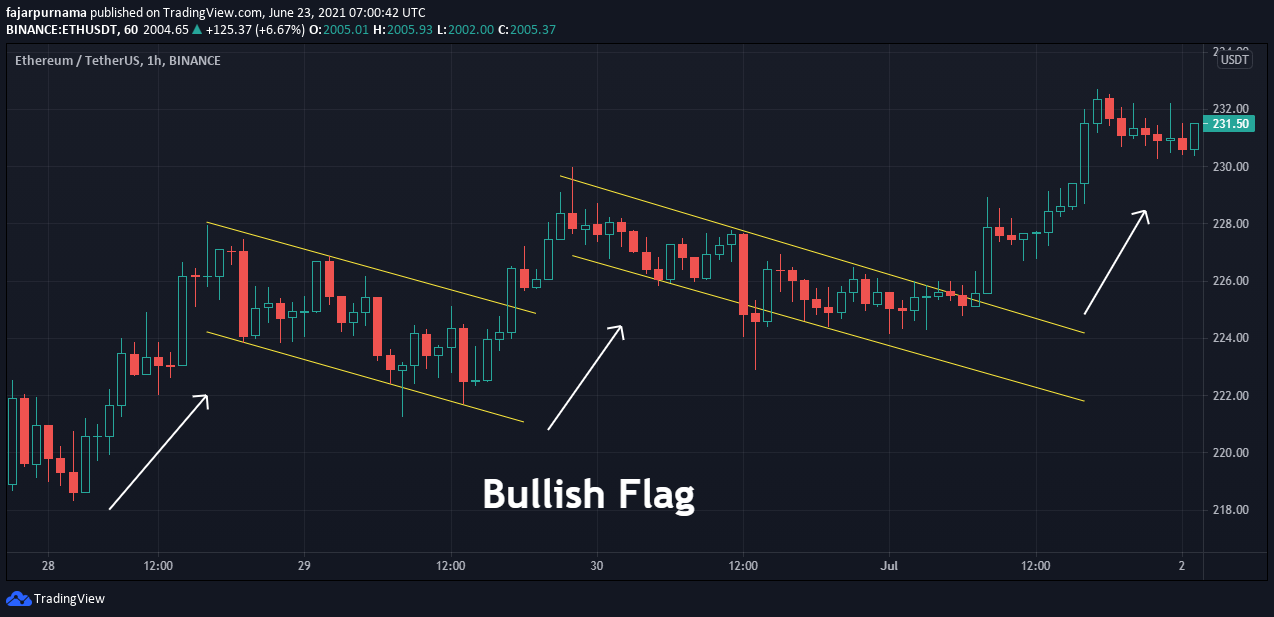
Bullish Flag
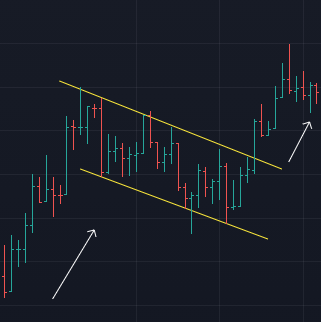
After drawing upper and lower trend line on a bullish corrective phase and found the lines seemed parallel, try drawing a parallel channel. If most of the swing fits then it is most likely a bullish flag. Really, it looks like a flag. Many traders place a buy order above the upper trend line where they believe the price will continue the bullish trend when the price breaks the pattern.
Bearish Flag
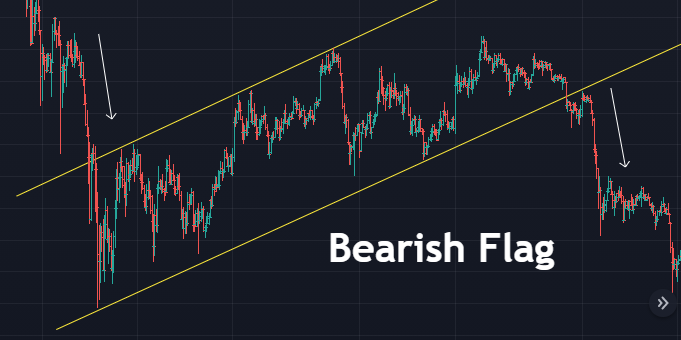
While bullish flag occurs on bullish trend, bearish flag occurs on bearish trend. The corrective phase of a bullish trend is downward and bearish trend is upward. Still looks like a flag but up side down.
Bullish Pennant
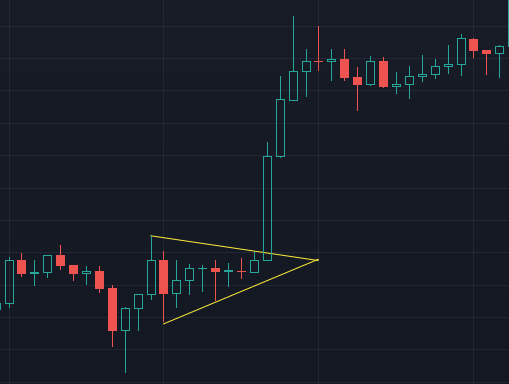
A bullish pennant occurs on a bullish corrective phase where the lower and upper trend line goes on different direction that converges. Pennant is very similar to wedges and triangles. Some argues that pennant have maximum of 3 swings, some argues that pennant have no waves, no gaps, but bars or candles that converges or gets smaller. Whatever the different arguments, all agreed that pennants are shorter and smaller.
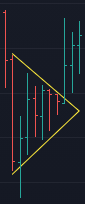
Bearish Pennant
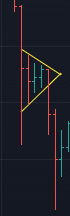
A bearish pennant is a pennant pattern occurs during a bearish corrective phase.
Rising Wedge
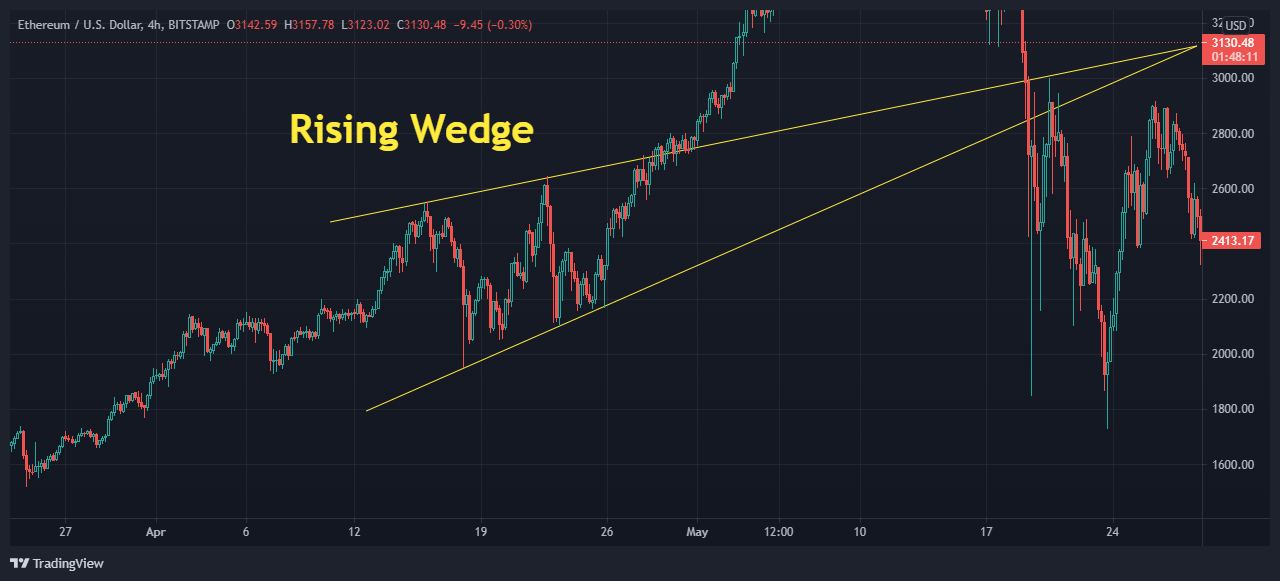
Unlike pennants and triangles, rising wedge converges but both lower and upper trend lines goes into the same upper direction. Theoretically, the price will break the upper trend line and continues its bullish trend. The detailed swings maybe seen as separate impulsive and corrective phase but zooming out, the broader picture can generally be a corrective phase.
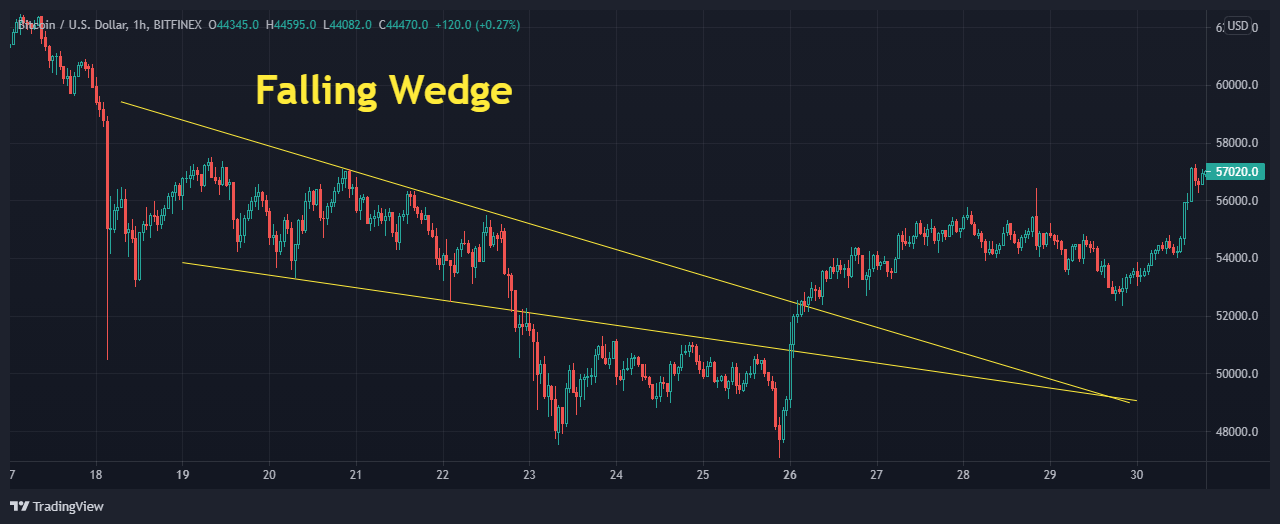
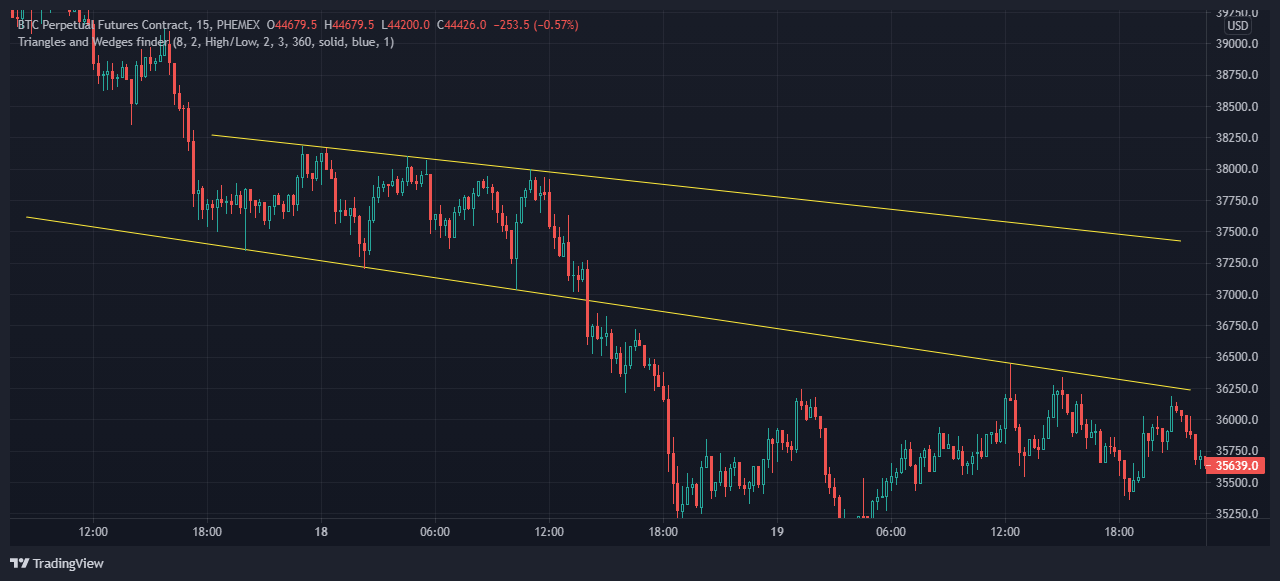
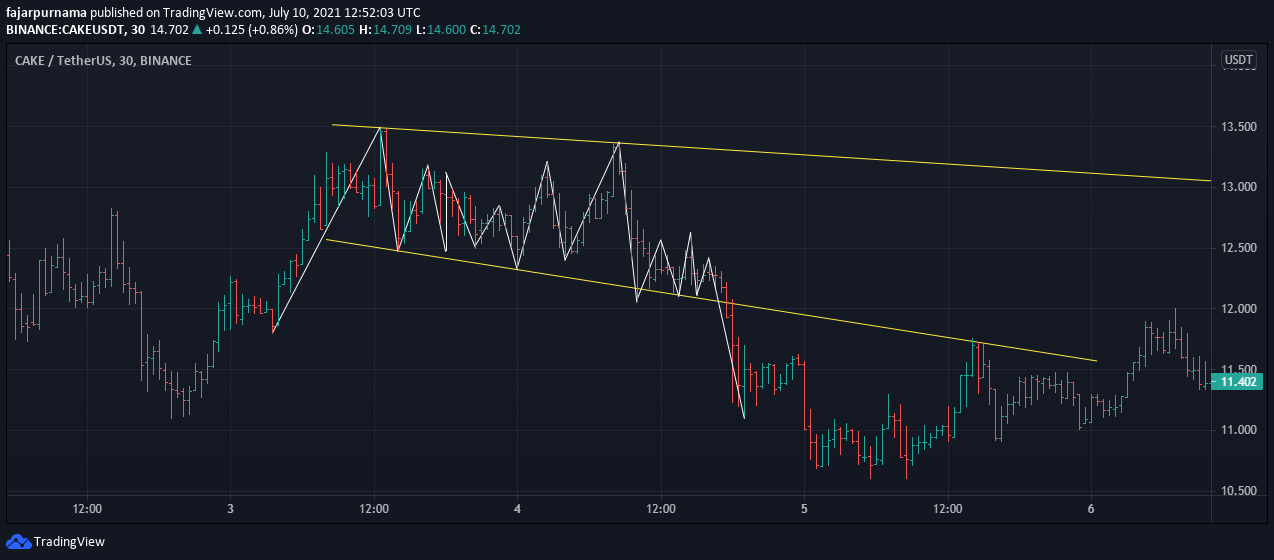
Falling Wedge
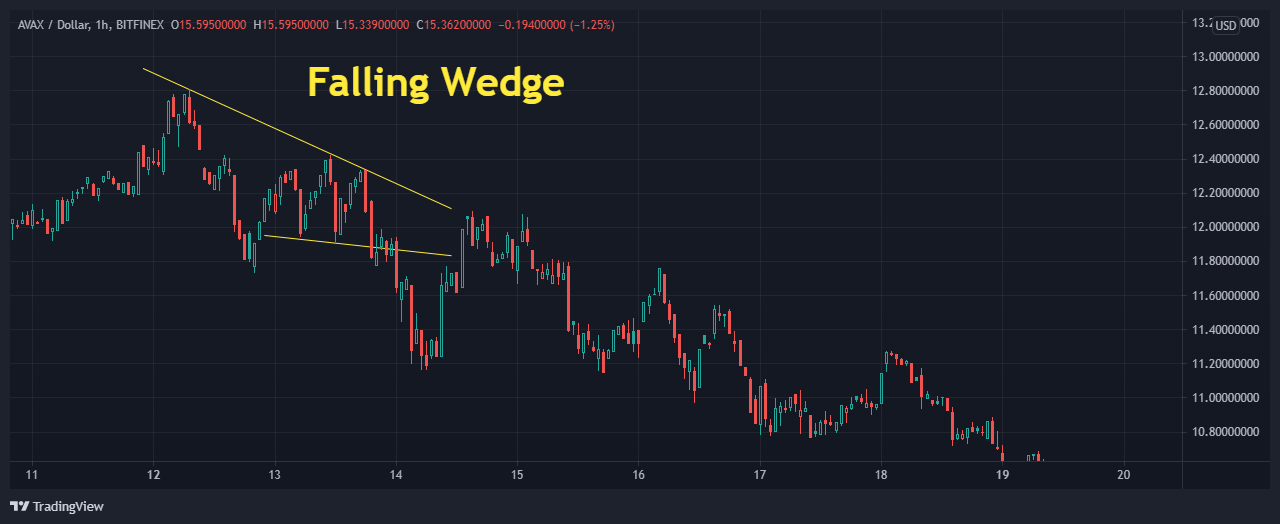
While rising wedge’s trend lines goes into upper direction, falling wedge’s trend lines goes into lower direction.
Ascending Broadening Wedge
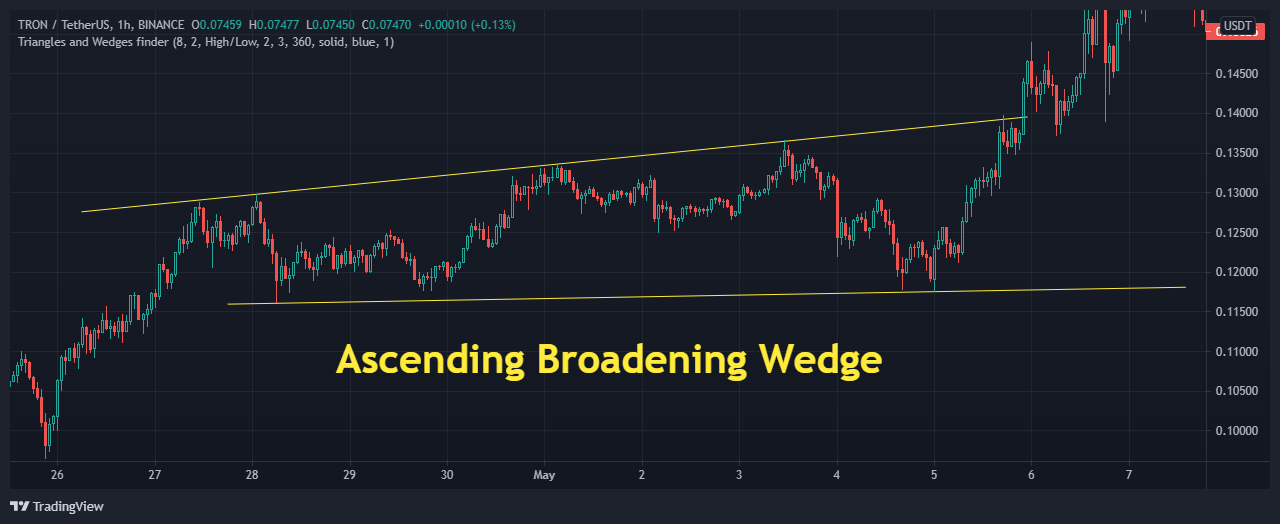
While the trend lines on rising wedge converges, trend lines on ascending broadening wedge diverges.
Descending Broadening Wedge
While ascending broadening wedge’s trend lines goes into upper direction, descending broadening wedge’s trend lines goes into lower direction.
Cup and Handle
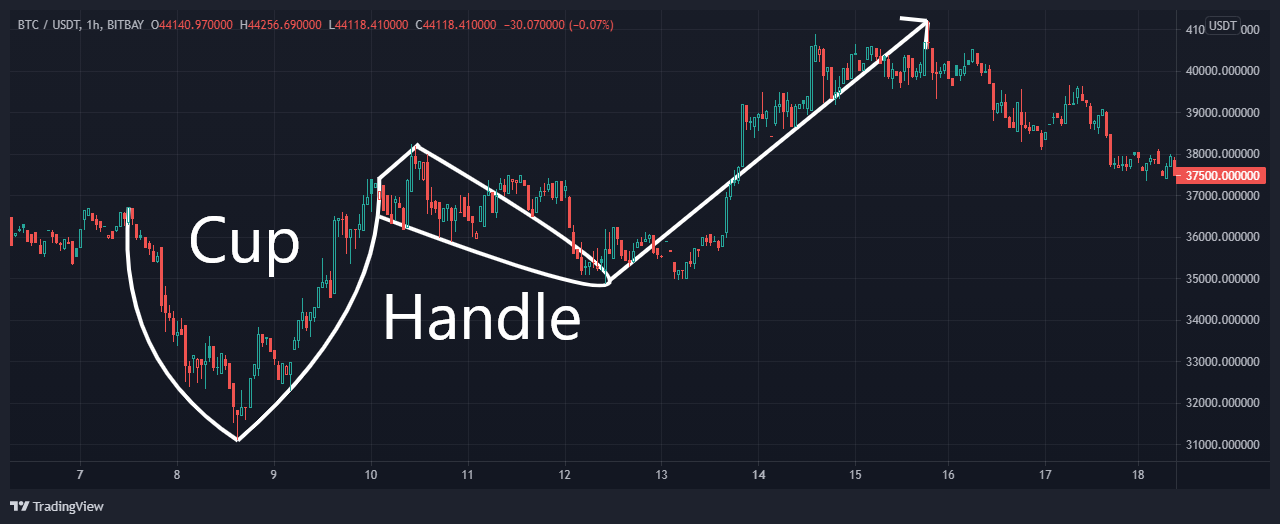
Unlike other popular continuous patterns, cup and handle uses supports and resistance to identify. The swing should at least be similar to “V” where there is a bottom and two tops on similar prices. The rounder the bottom like a “U”, the more likely a cup to be valid. The handle usually corrects at most 50% and very rarely reaches 75%. After the bullish trend continues, the cup and handle pattern is formed.
Reverse Cup and Handle
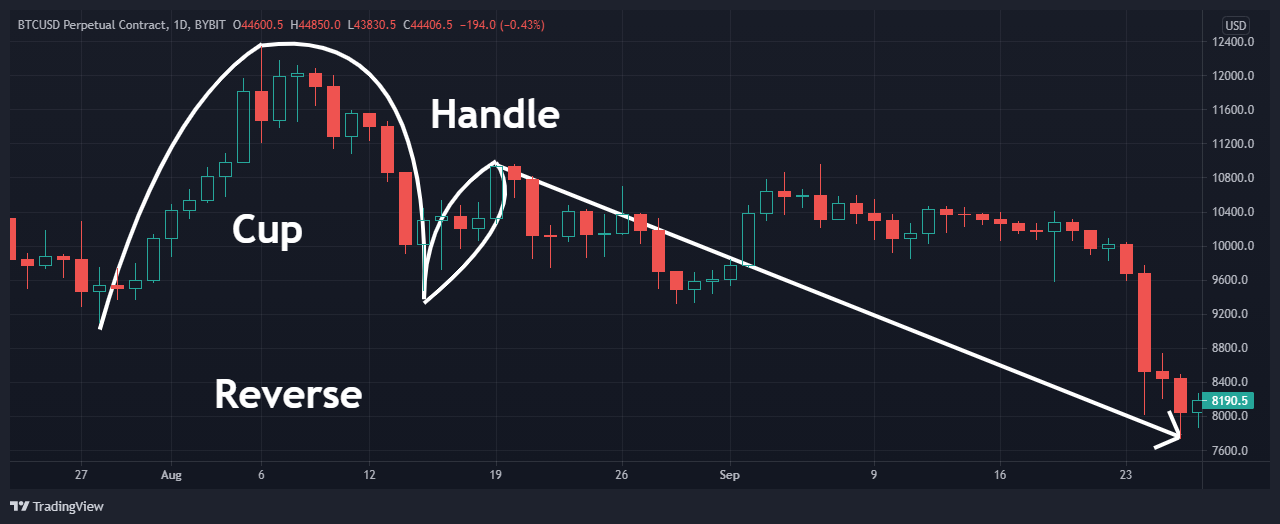
While cup and handle is bullish, reverse cup and handle is bearish. It is the upside down of cup and handle. Instead of a round bottom, there is a round top, and the handle gives hope for investors that the price may flip back to bullish only the be met with a slamming bear.
Either Patterns
Either classic chart patterns can either continue the trend or reverses. Classic chart pattern traders waits until the price breaks the pattern. After that, traders set a position following the price direction with a stop loss at the other side of the chart pattern’s breaking line.
Symmetrical Triangle
Unlike wedges, lower and upper trend lines goes in different direction but converges but unlike pennant, it forms a wave. Triangles are longer than pennant. Triangle is the most popular classic chart pattern on social media today.
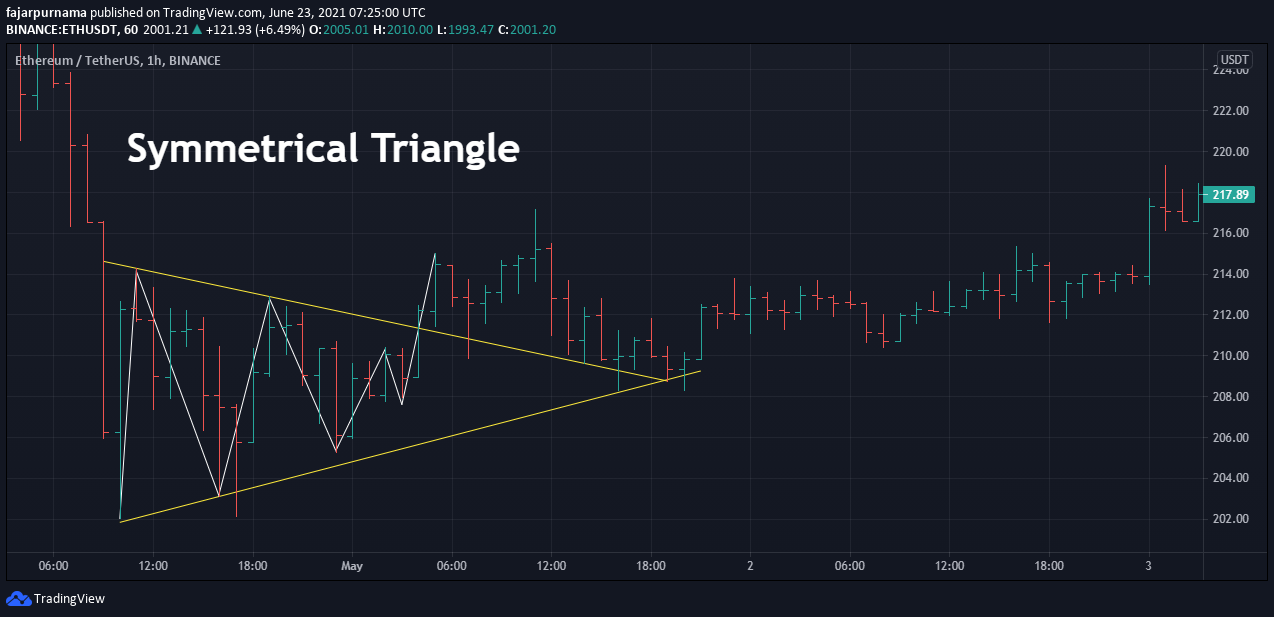
This is an example that a symmetrical triangle can go bullish.
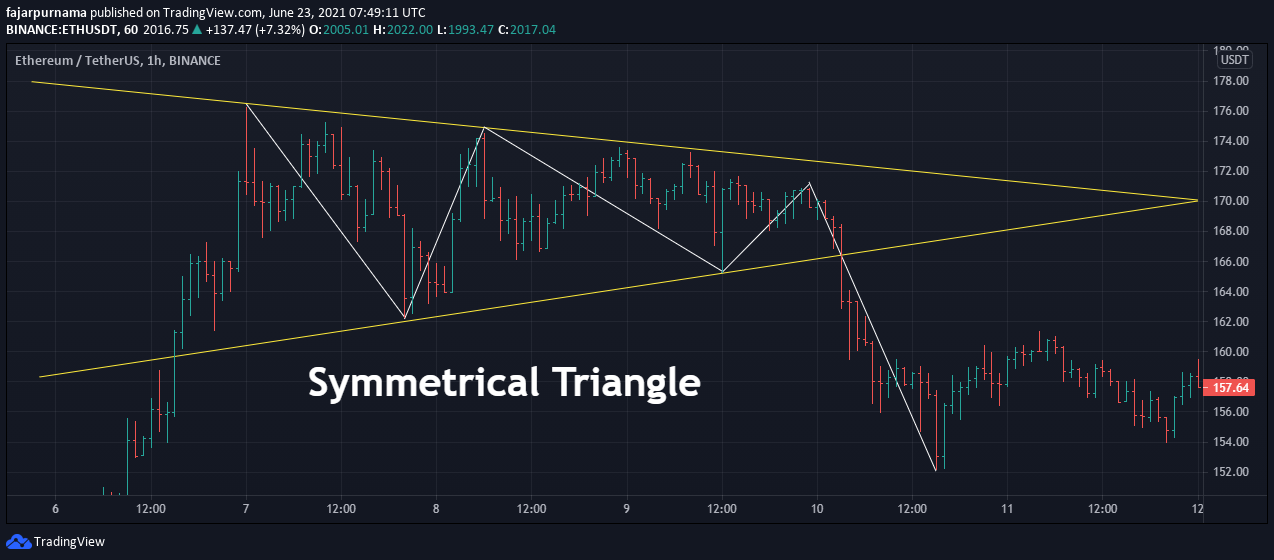
This is an example that a symmetrical triangle can go bearish.
Ascending Triangle
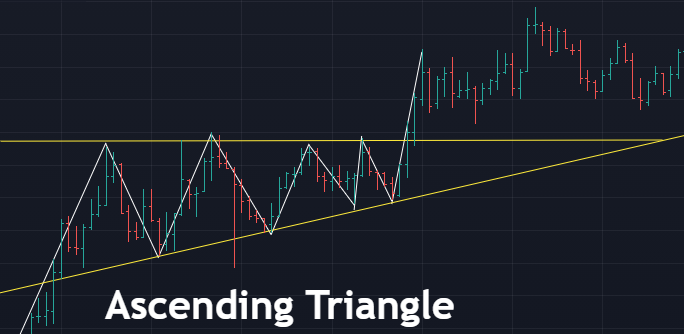
The upper trend line is horizontal and the lower trend line is moving upwards.
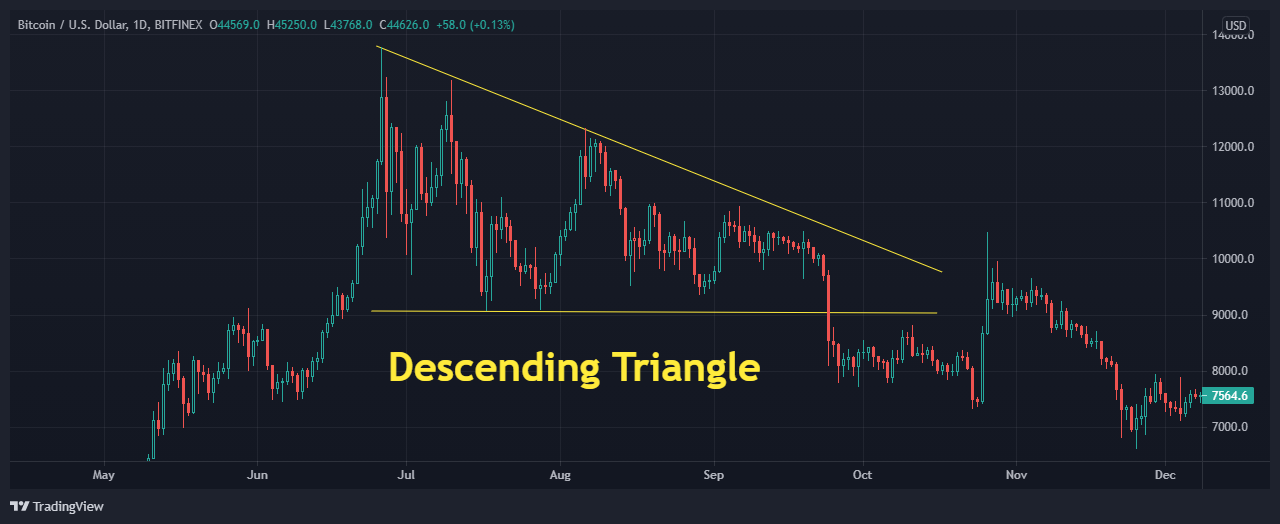
Descending Triangle
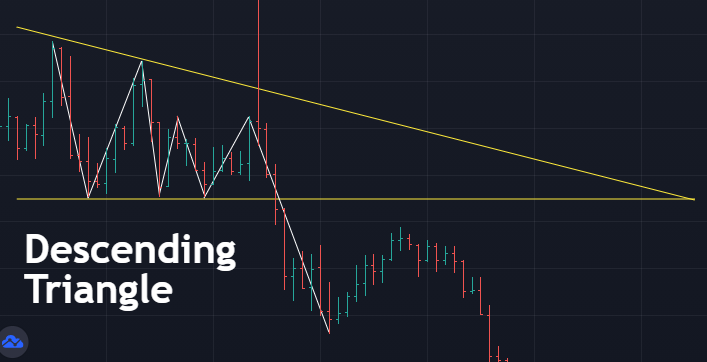
The lower trend line is horizontal and the upper trend line is moving downwards.
Broadening Wedge
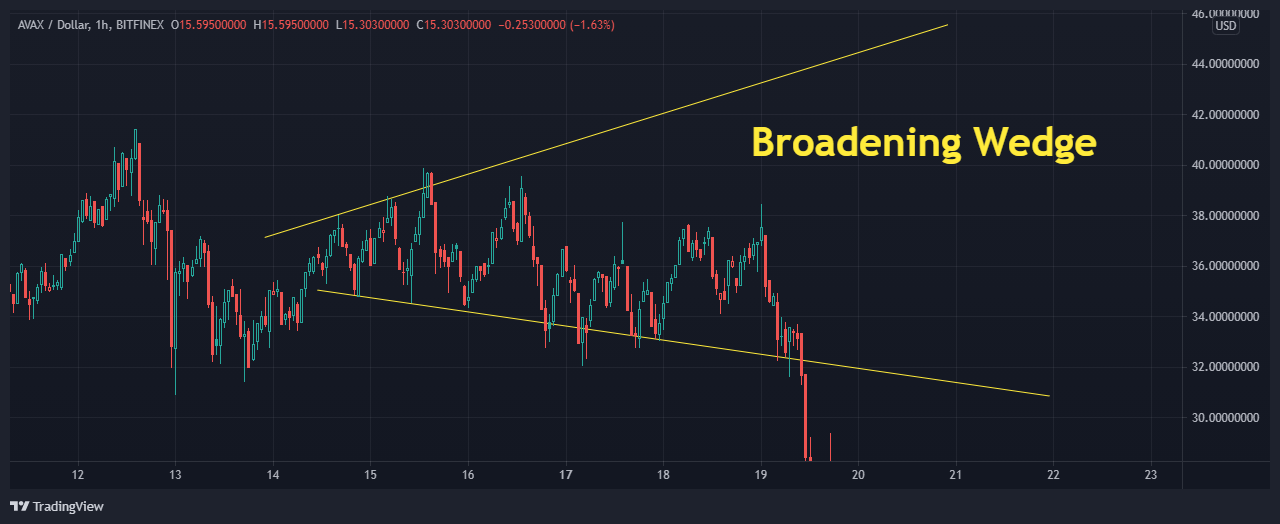
An inverted symmetrical triangle and a wedge that can go either ways.
Rectangle
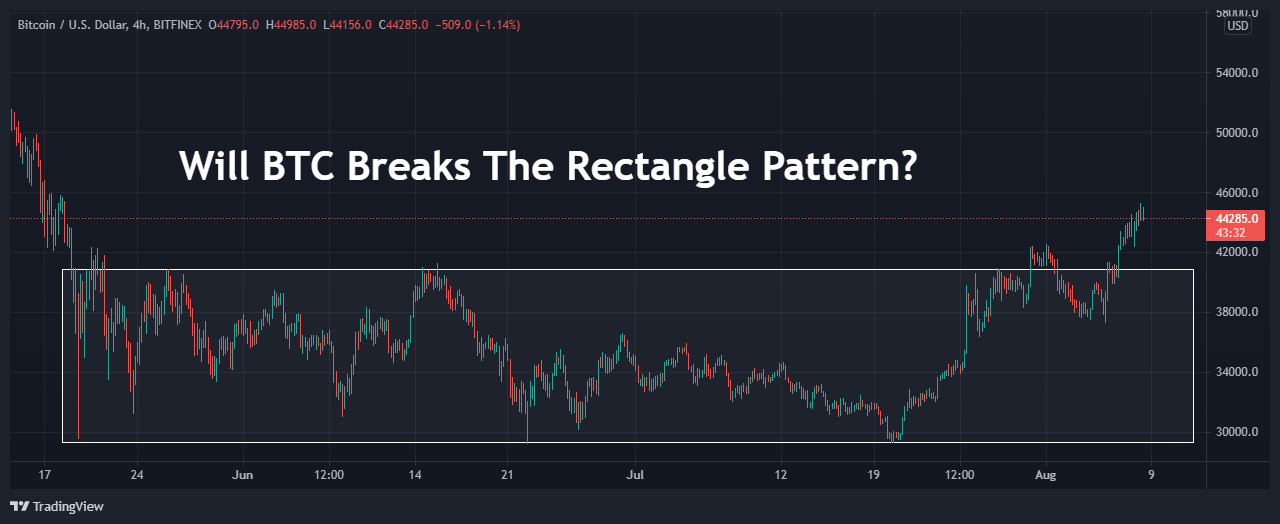
Both the lower and upper trend lines are horizontal where at the same time they are support and resistance lines. A prime example of a sideways trend. Usually it starts with a double bottom and a double top that continues forming more tops and bottoms at the same trend line.
Can Chart Pattern Fail?
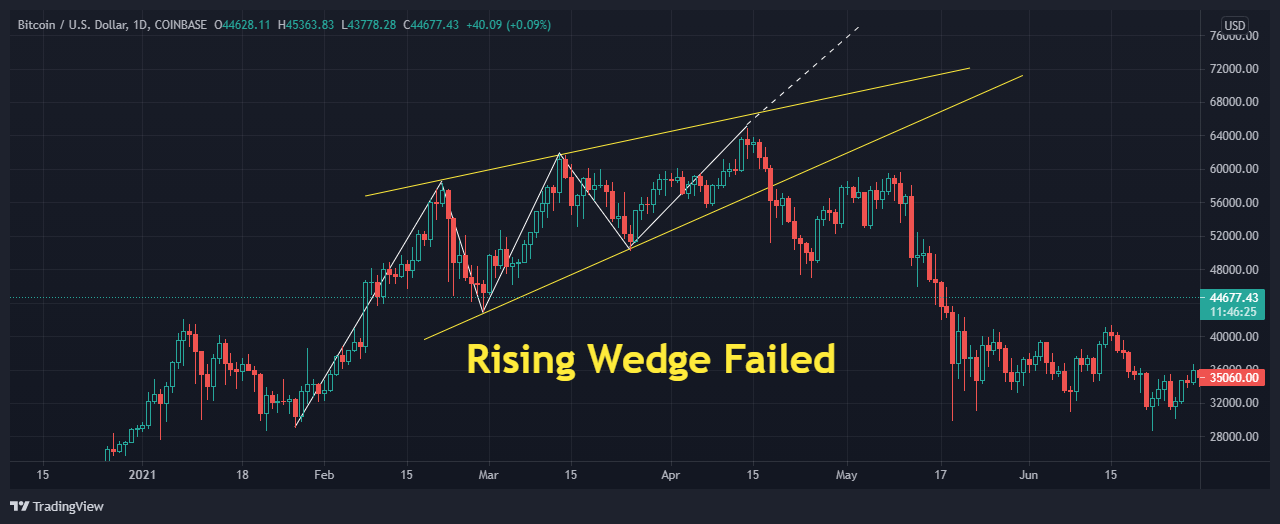
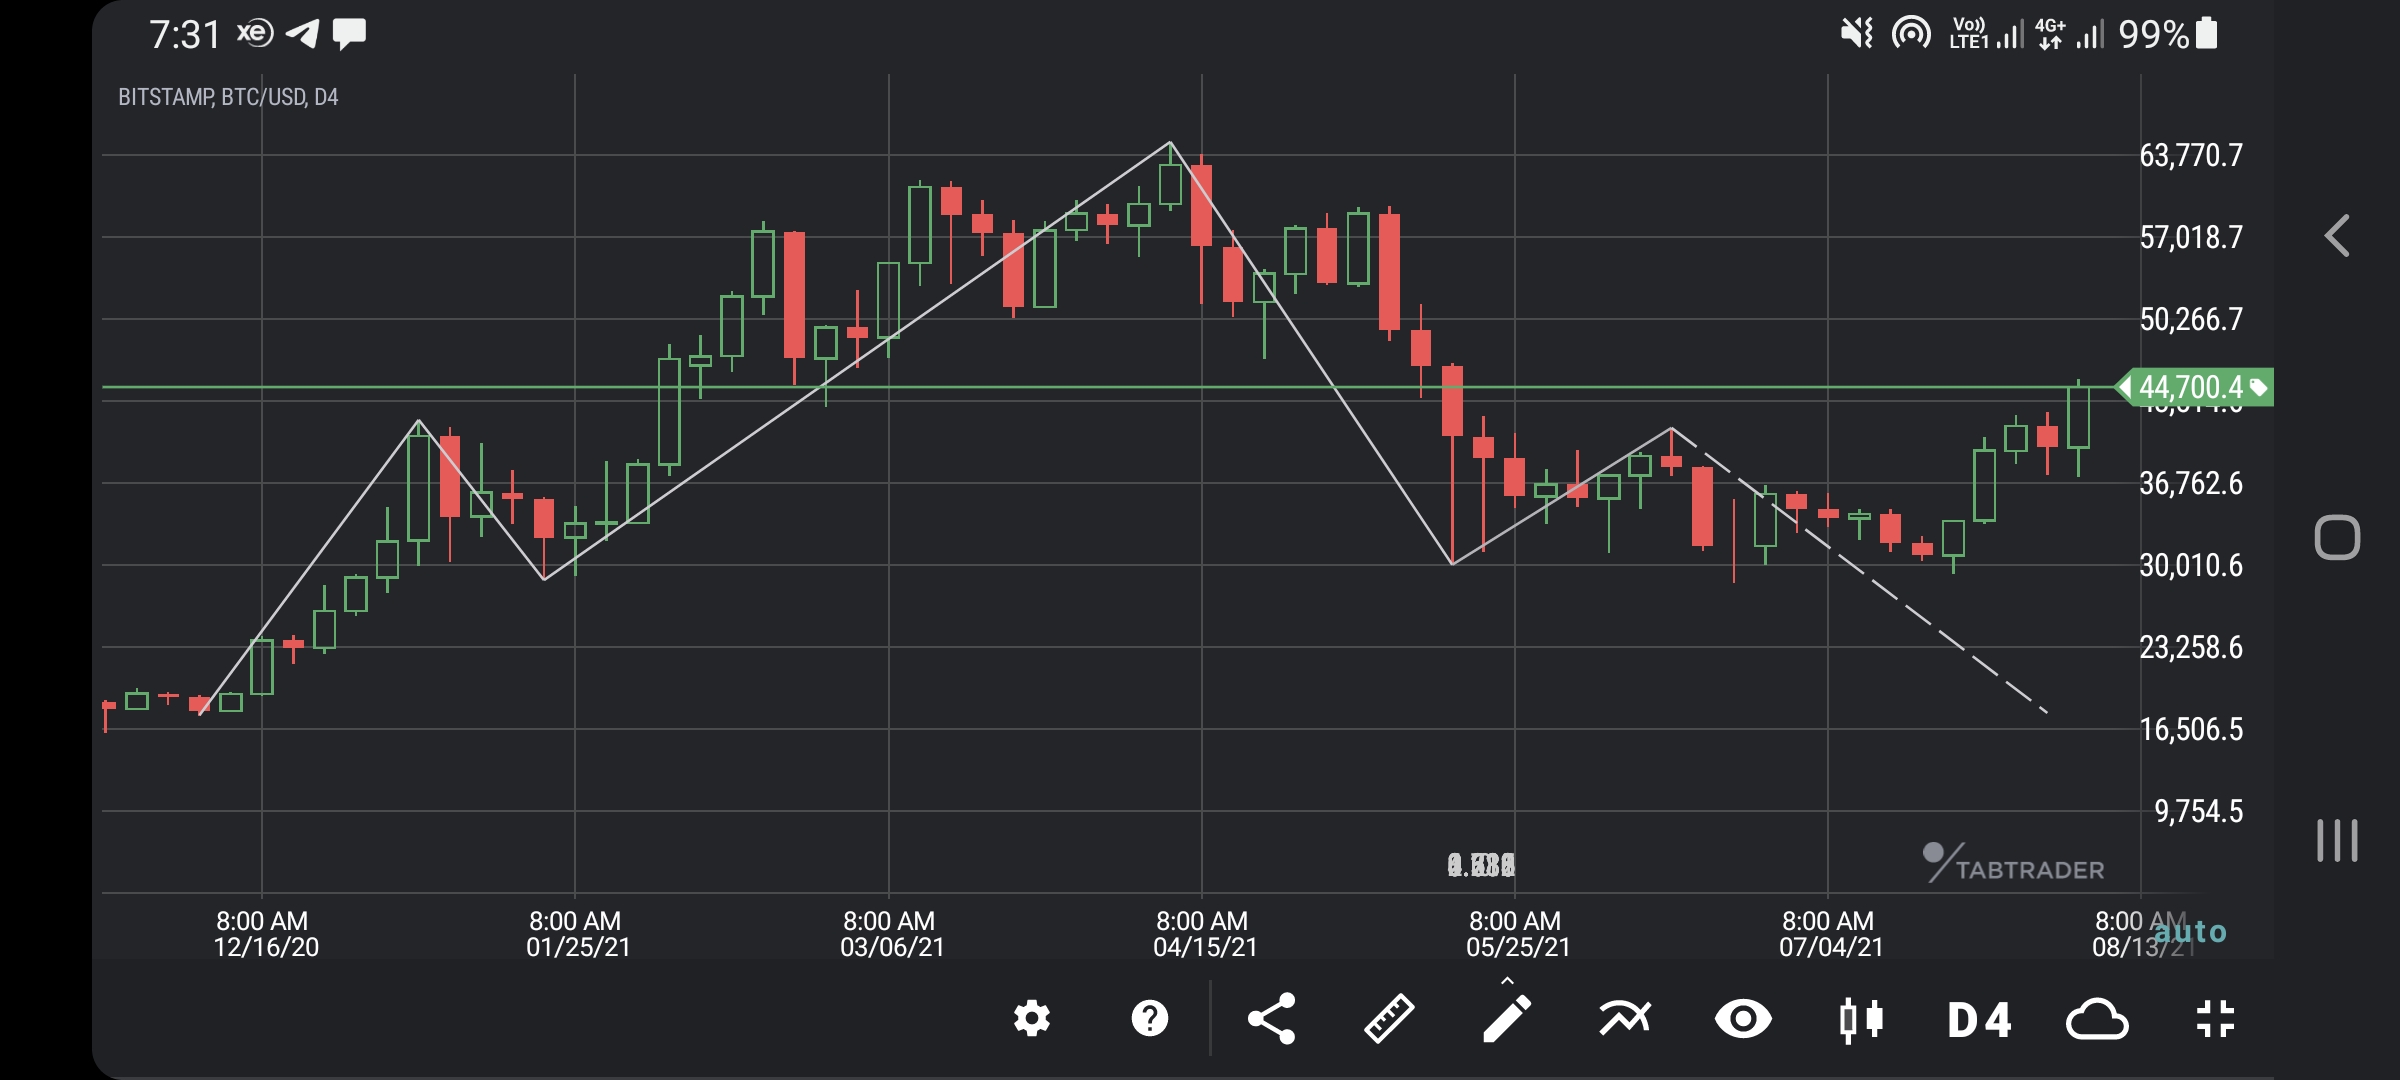
Yes it can. For example, if we stick to the theory that rising wedge as a continuous chart pattern, than Bitcoin would have surpassed $70000 in May 2021. Unfortunately it did not, and fell which is why experienced traders never stick to which patterns are continuous and which patterns are reversals and instead they simply rely on which trend line the price will break, lower trend line or upper trend line.
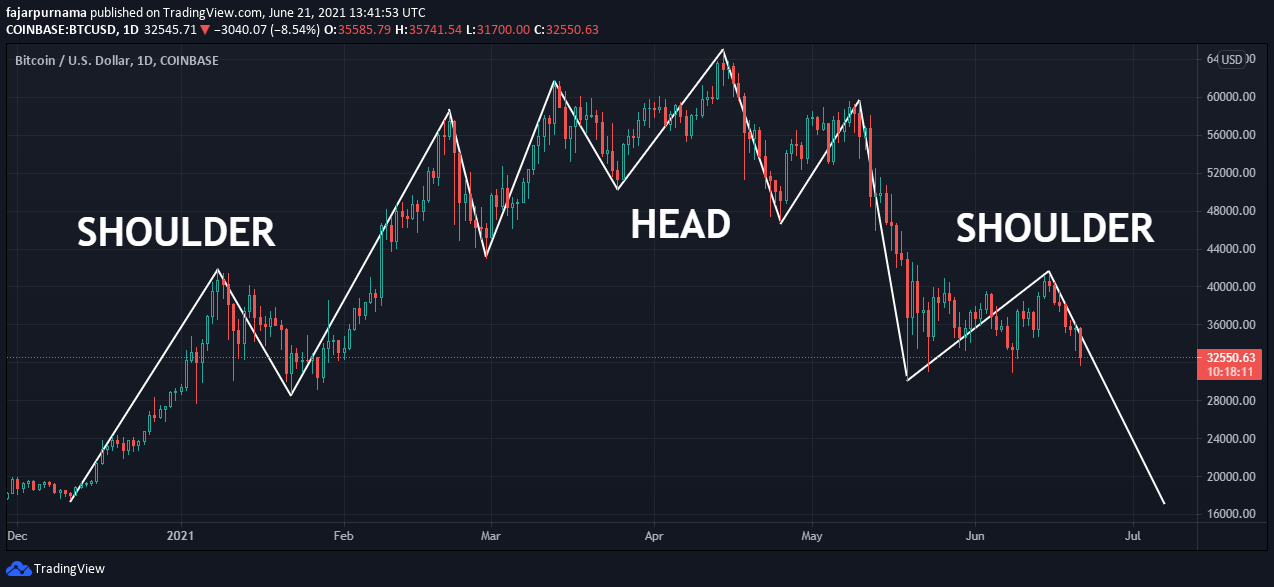
Not only Peter Schiff and other Bitcoin skepticism are calling for an immediate Bitcoin fall when recently a head and shoulders pattern seemed to form, but Bitcoin supporters as well such as Robert Kiyosaki intending to buy more Bitcoin in $24000 level. Many analyst made a more accurate analysis that Bitcoin will correct to $40000 first before it falls to $24000. Three times that Bitcoin failed to break above $40000 and four times Bitcoin bounced $29000. Finally, it failed to fall below $29000 and made it back to $50000 which finally invalidates the head and shoulders pattern.
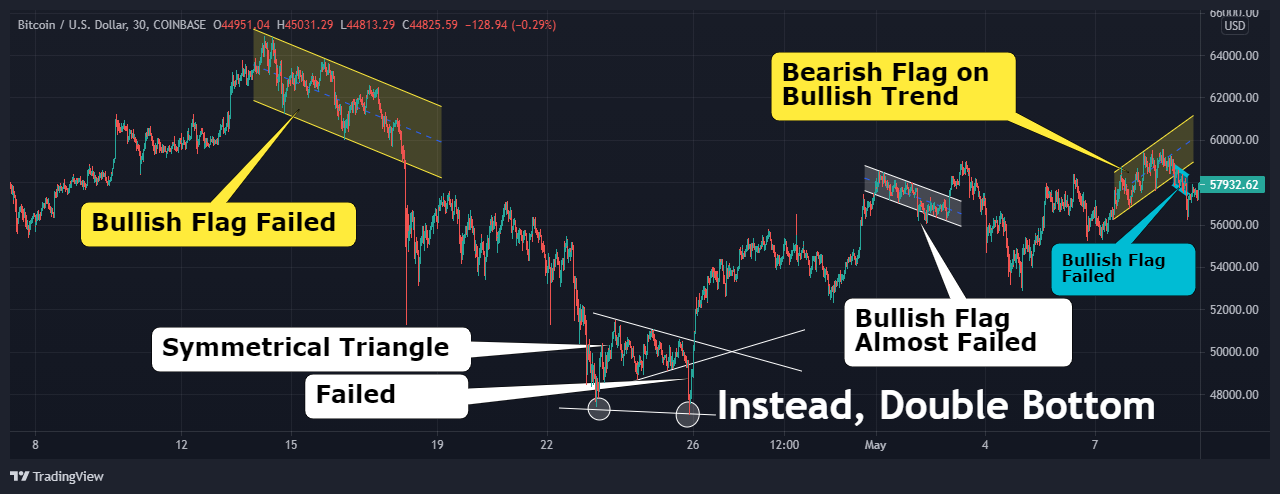
While chart patterns are one of the best for presentation and sharing technical analysis to the public, correctly identifying and profiting from chart patterns are different things. In live trading, fail chart patterns does not occur more often than a changing chart pattern. For example, when we though a falling wedge is forming, instead it breaks upwards. We may mistakenly identified a bullish flag as a falling wedge. First the previous trend or impulsive phase is bullish. A falling wedge usually occurs after a bearish trend of impulsive phase. Second, drawing the trend lines on the candle shadows is not the only way. We can draw trend lines on the closing price or simply use a line chart which may show a bullish flag instead of a falling wedge. Another example is a that we make a quick assumption when a double bottom or a double top formed when a rejection occurs on the same line but it is not formed yet and instead may return and break the line. Therefore, to predict a forming chart pattern better is to go back to the basics of swing, trend, support & resistance, and supply & demand, know popular candle stick patterns, use technical indicators, and never forget the DOW Theory.
Mirrors
- https://www.publish0x.com/cryptocurrency-101-for-users/financial-technical-analysis-crypto-narrative-chapter-5-clas-xglzzxp?a=4oeEw0Yb0B&tid=github
- https://0darkking0.blogspot.com/2021/11/financial-technical-analysis-crypto.html
- https://0fajarpurnama0.medium.com/financial-technical-analysis-crypto-narrative-chapter-5-classic-chart-pattern-bb9fe8d83b03?source=friends_link&sk=86bb4b6e4ee146e90a7707a56e1eb55c
- https://0fajarpurnama0.github.io/cryptocurrency/2021/06/09/fta-crypto-chapter-5
- https://hicc.cs.kumamoto-u.ac.jp/~fajar/cryptocurrency/fta-crypto-chapter-5
- https://steemit.com/cryptocurrency/@fajar.purnama/financial-technical-analysis-crypto-narrative-chapter-5-classic-chart-pattern?r=fajar.purnama
- https://leofinance.io/@fajar.purnama/financial-technical-analysis-crypto-narrative-chapter-5-classic-chart-pattern?ref=fajar.purnama
- https://blurt.blog/cryptocurrency/@fajar.purnama/financial-technical-analysis-crypto-narrative-chapter-5-classic-chart-pattern?referral=fajar.purnama
- https://0fajarpurnama0.wixsite.com/0fajarpurnama0/post/financial-technical-analysis-crypto-narrative-chapter-5-classic-chart-pattern
- http://0fajarpurnama0.weebly.com/blog/financial-technical-analysis-crypto-narrative-chapter-5-classic-chart-pattern
- https://read.cash/@FajarPurnama/financial-technical-analysis-crypto-narrative-chapter-5-classic-chart-pattern-03cbde55
- https://www.loop.markets/financial-technical-analysis-crypto-narrative-chapter-5-classic-chart-pattern/
- https://www.floyx.com/article/0fajarpurnama0/the-basics-of-financial-technical-analysis-even-in-000113f7ae
- https://markethive.com/0fajarpurnama0/blog/financialtechnicalanalysiscryptonarrativechapter5classicchartpattern