Intermediate Financial Technical Analysis even in Crypto
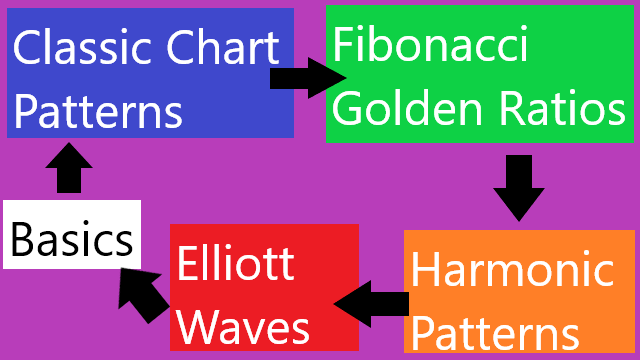
Basic Financial Technical Analysis is most of the time enough for new investors to invest by determining entry points of popular crypto assets and set targets to take profit given that they did their/your own research (DYOR) which includes fundamental analysis and sentiment analysis. However, it is not enough for traders to time the market as mastery of the basics only give maximum of 40% accuracy said many technical analyst. Therefore for anyone to become a trader must continue to the next level which is intermediate technical analysis. In this article, I list the intermediate materials where I left hyperlinks to the chapters I wrote in each headings so click on them to learn more of the intermediates in detail.
5. Classic Chart Patterns
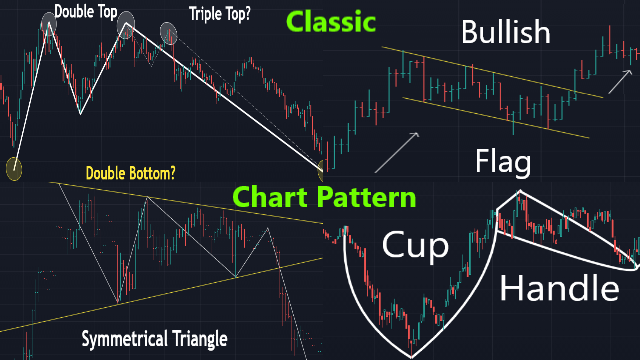
Believe it or not, the most popular technical analysis that is classic chart pattern is actually an intermediate material because it relies correctly drawing lower and upper trend line plus other basics to avoid the traps of fail chart patterns. While classic chart patterns are categorized into continuous and reversals but generally are to swing trade inside the pattern and wait for the price to break the pattern to see the next trend direction. In other words, intermediate traders place buys and sell limits in the trend lines of the classic chart pattern and stop loss or buy/sell stop slightly outside of the trend lines or set an alarm when a price breaks the pattern, wait for a pullback, then place instant/market order. Here are the popular classic chart patterns:
Continuous Patterns
- Flags
- Pennants
- Wedges
- Cup and Handle
Reversal Patterns
- The Double Tops and Bottoms and Triples and More.
- Diamonds
- Head and Shoulders
Either Patterns
- Triangles
- Rectangles
6. Fibonacci Golden Ratios
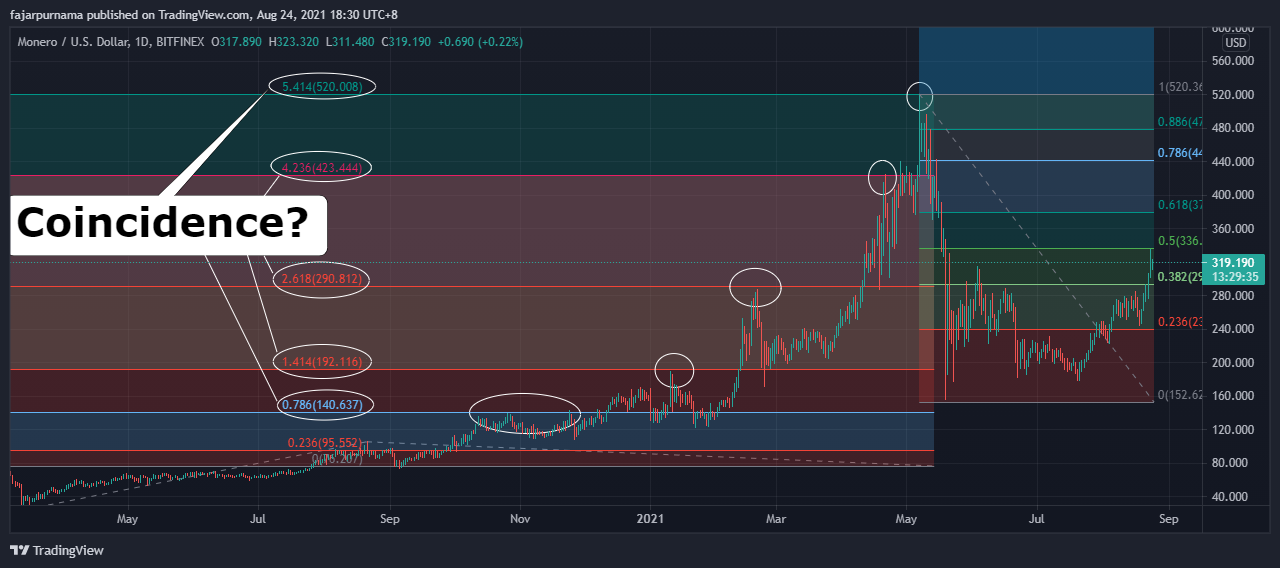
In the basics we always retrace historical data of previous support and resistance lines and supply and demand (S&D) areas as those place have high probability for the price to visit. Intermediate traders often measures the Fibonacci golden ratios number as the whole of nature often touches those numbers and after that retrace whether those numbers are inline with pervious support & resistance lines and S&D areas. They often put buy and sell limits on those numbers and stop loss if exceed certain percentage. When a price is in action, intermediate traders does not take action immediately but wait until the price touches the Fibonacci godlen ratio numbers. Other than that, their indicator settings also uses the Fibonacci sequence numbers. For example, I no longer use the classic 20, 50, and 200 days moving averages (MA) and now uses the 21, 55, 144, 233, and 377 period MA.
7. Harmonic Patterns
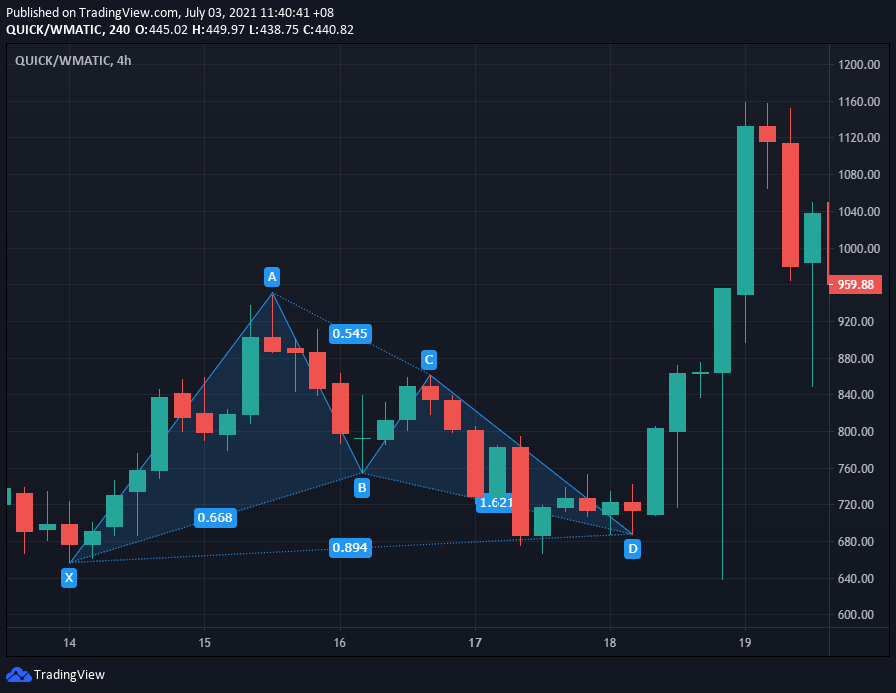
Although harmonic patterns are mostly “M”s and “W”s, they consider the psychology of the traders in the background. Harmonic patterns forms on a corrective phase after an impulsive phase. Assuming that a trend continues, there are records that prices often moves in certain exact ways within the corrective phase. Unlike classic chart patterns which are random, harmonic patterns have exact Fibonacci golden ratio measurements that rarely deviates. Just like harmony itself, the next sound must be selected and not random or else it will be in disharmony. An action must match previous actions for an activity to be in harmony. The same as prices, the future price must match previous prices or else the market will be in disharmony. Therefore, harmonic traders calculates the Fibonacci golden ratios of the previous price movements within the corrective phase and once matching numbers are found, they will place buy and sell limit exactly on the predicted next Fibonacci golden ratio number that the price will move to and a stop loss just a very small percentage outside that point. Though I found many harmonic patterns, but the most popular ones are Gartley, Butterfly, Bat, and Crab.
8. Elliott Wave
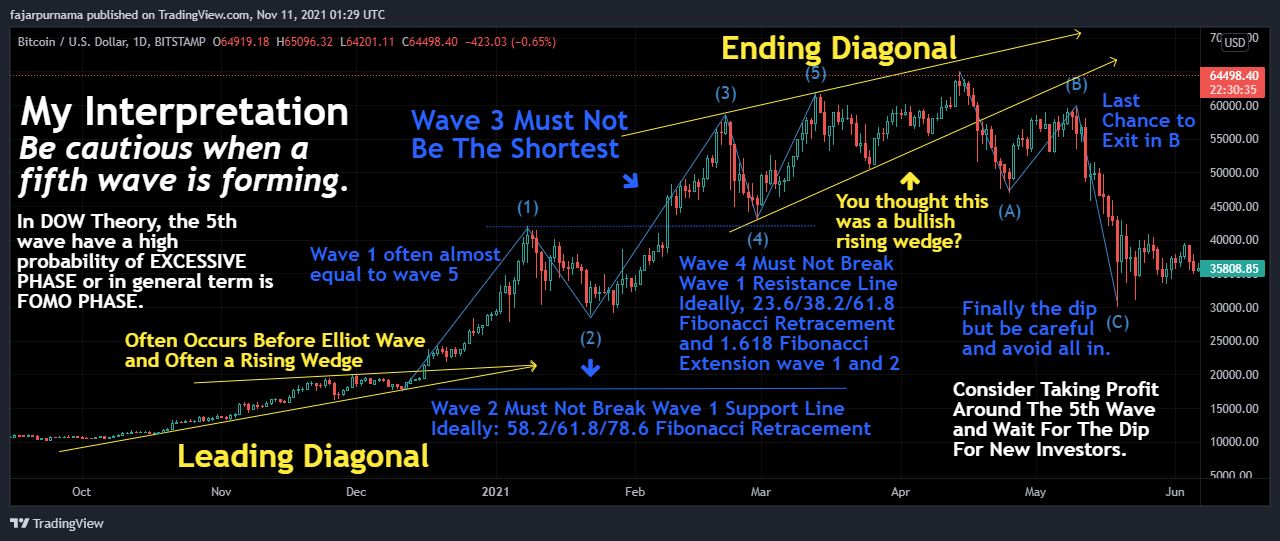
Elliott Wave traders already took profit from Bitcoin on May 2021 because to them is clear that the bull market ended. Elliott Waves are often valid because many traders believes in the DOW Theory that a trend persists until clear reversal. Therefore, each time the price breaks the resistance line, no traders will sell near that resistance line and those who are left out of the previous break will see the price going down near the previous resistance line as a discount and buy. The vice versa when the price breaks the support line, almost every trader will get disappointed and will not want to hold the asset. Going back to the bullish case however, when the price made the fifth wave, very often the case that buyers get exhausted where often trend reversals occurs after the fifth wave. Early investors are definitly satisfied and will take profit. With no more buyers, speculators who feared of missing out (FOMOed) will panic and start massive selling. Traders who mistaken the sixth wave for a dip will buy and create a last chance for traders and investors to exit. Once the seventh wave ended, all who are lefted out are in despair. The next case either, will they get buried with continuous bearish trend, or will there be hope of new investors and speculators to restart the bullish trend?
Example Technical Analysis
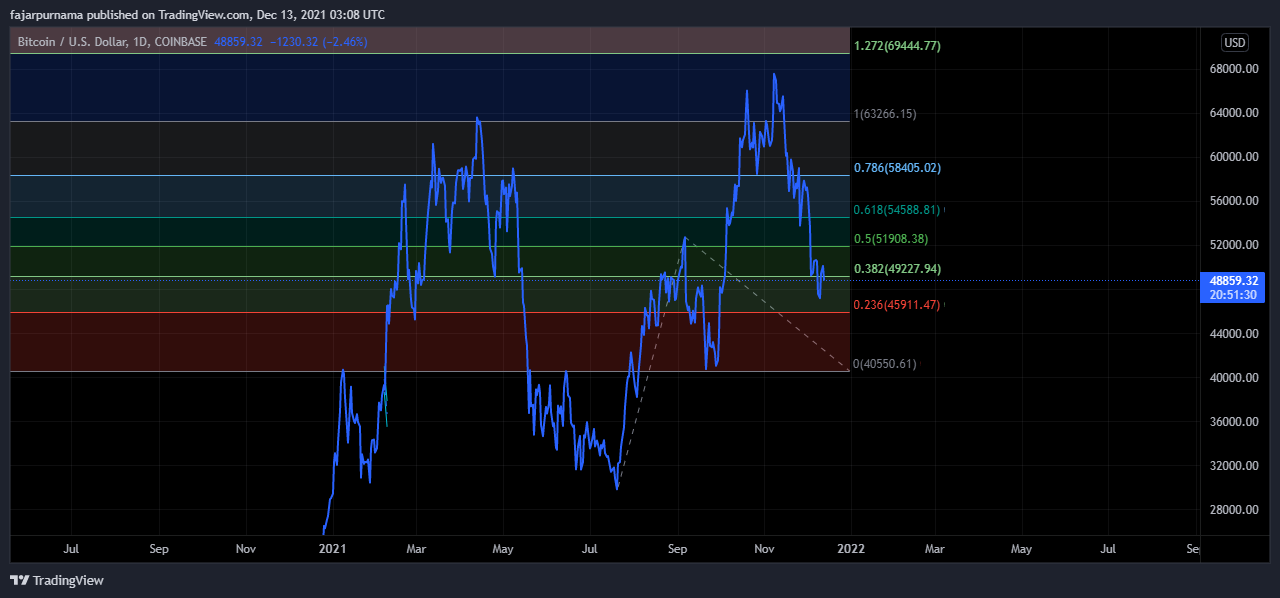
In each chapters, all of the examples are backtesting which means that analysis was performed on existed data or occurred event. This time, I will give examples of my analysis where I try to predict future prices. By the way, a Hive user asked me to pull a Fibonacci Extension to predict the current all time high of Bitcoin’s cycle and my answer was my previous hope was $70000 but it did not reach and for the current bear market, I answered that I cannot pull because the bottom is not yet confirmed for me.
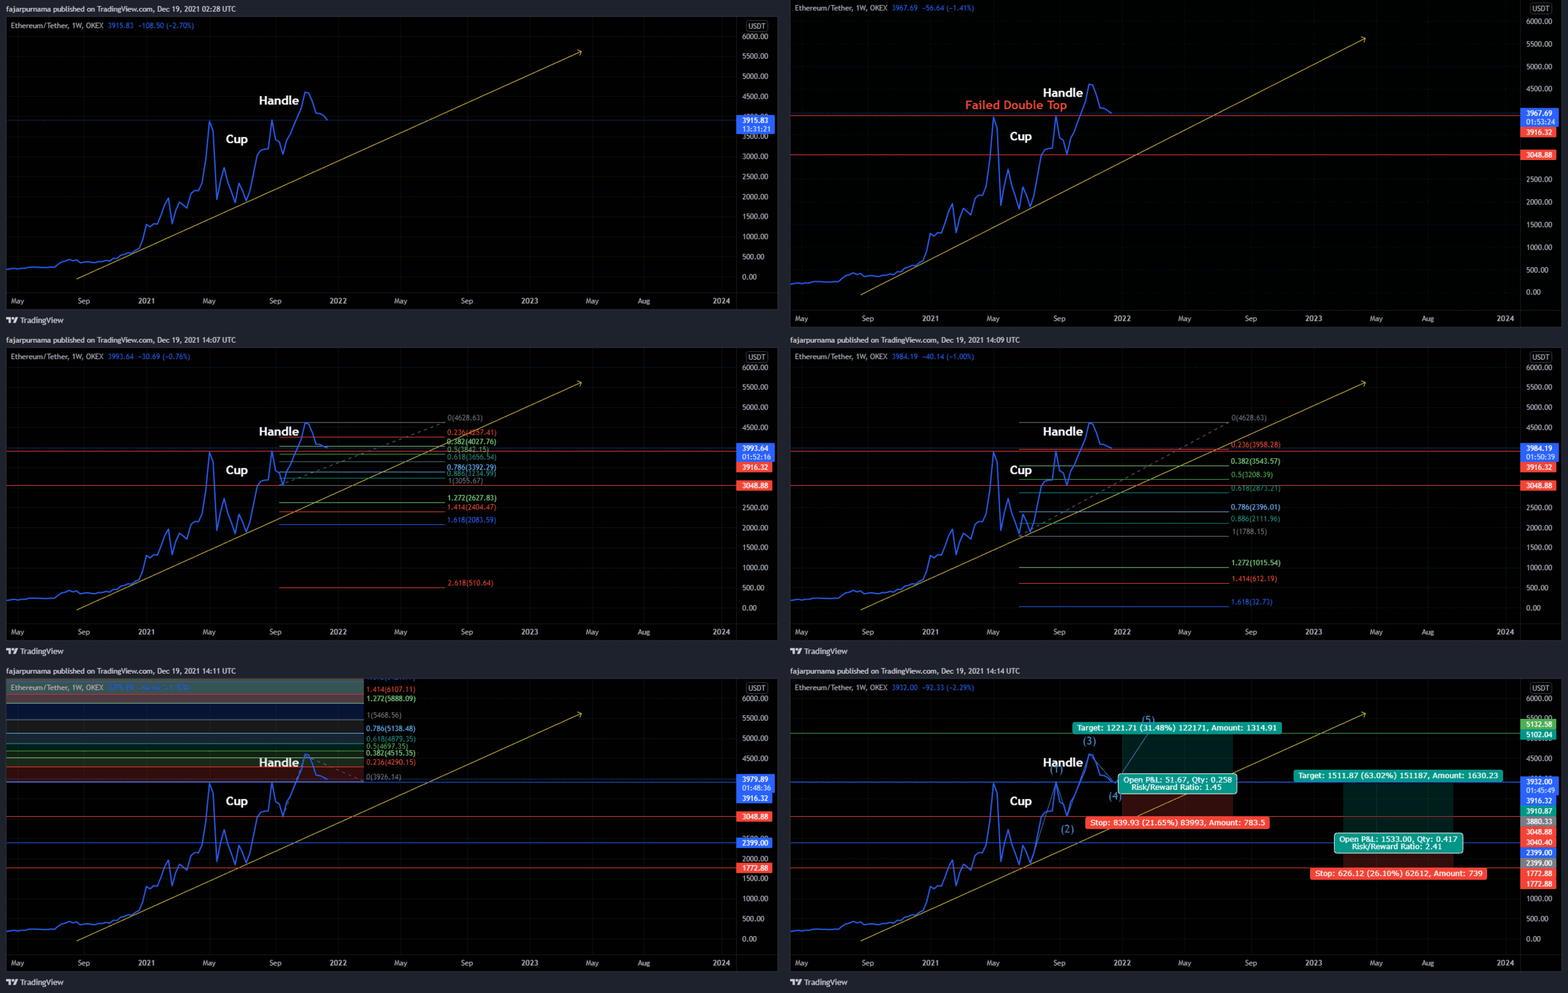
This is Ethereum’s price action December 2021. A double top almost formed but failed and formed a cup and handle instead. If the price bounces at the current rate, then can potentially form an Elliott Wave. If so, a long position is recommended and a stop loss if the price breaks the trend line.
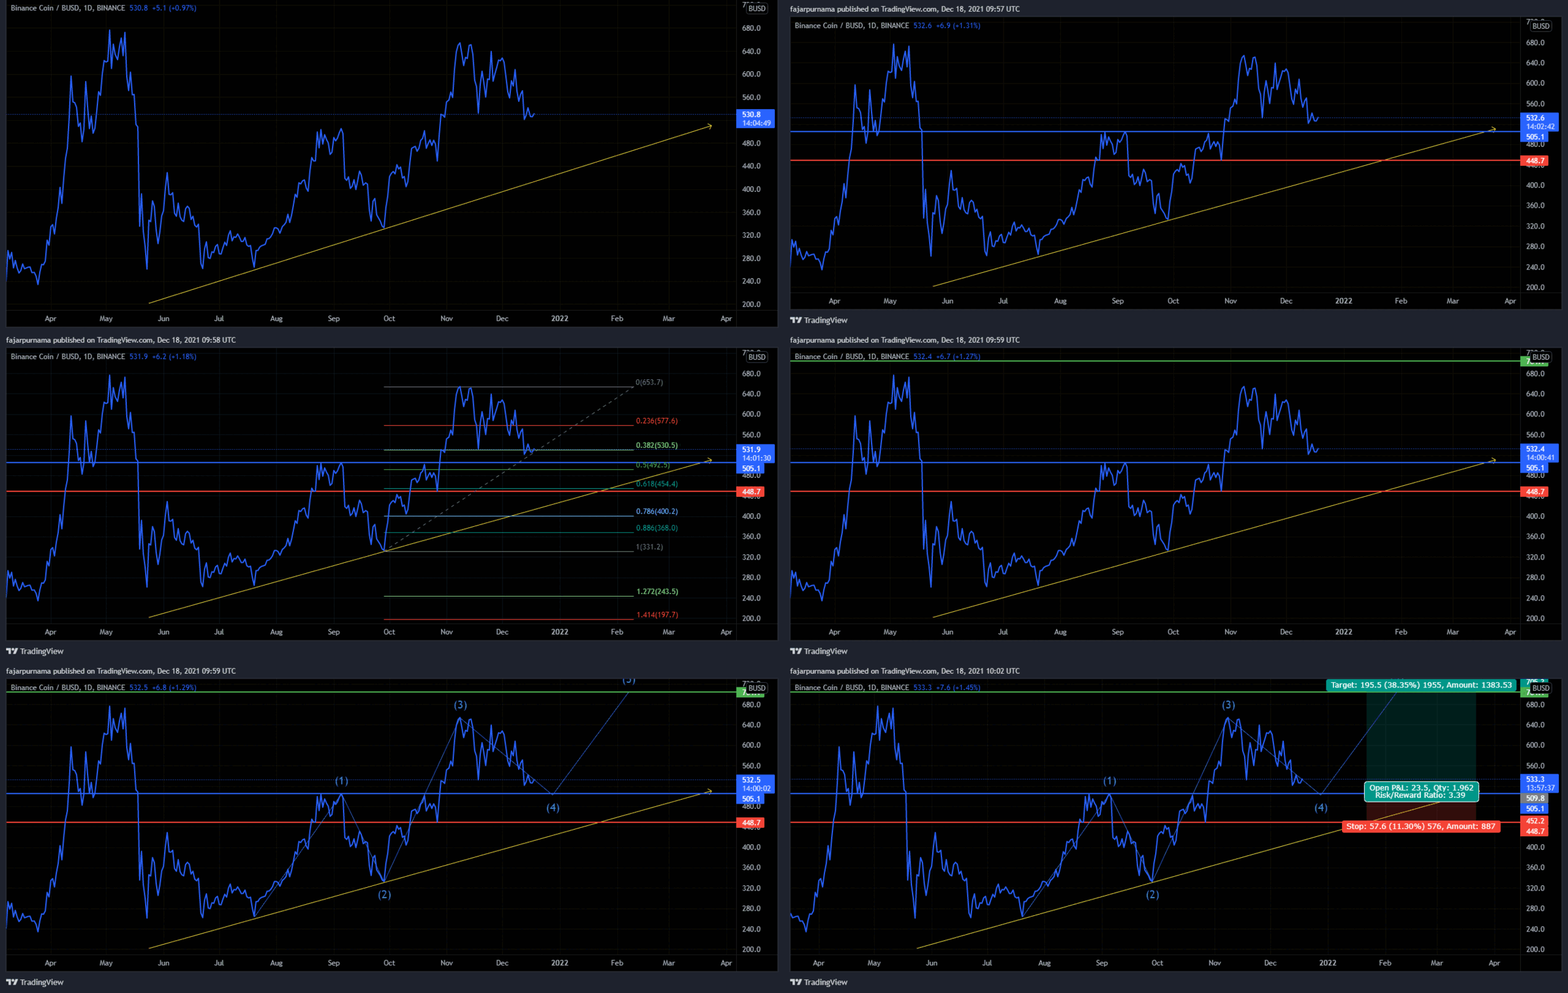
The same Ethereum’s technical analysis applies to Binance Smart Chain.
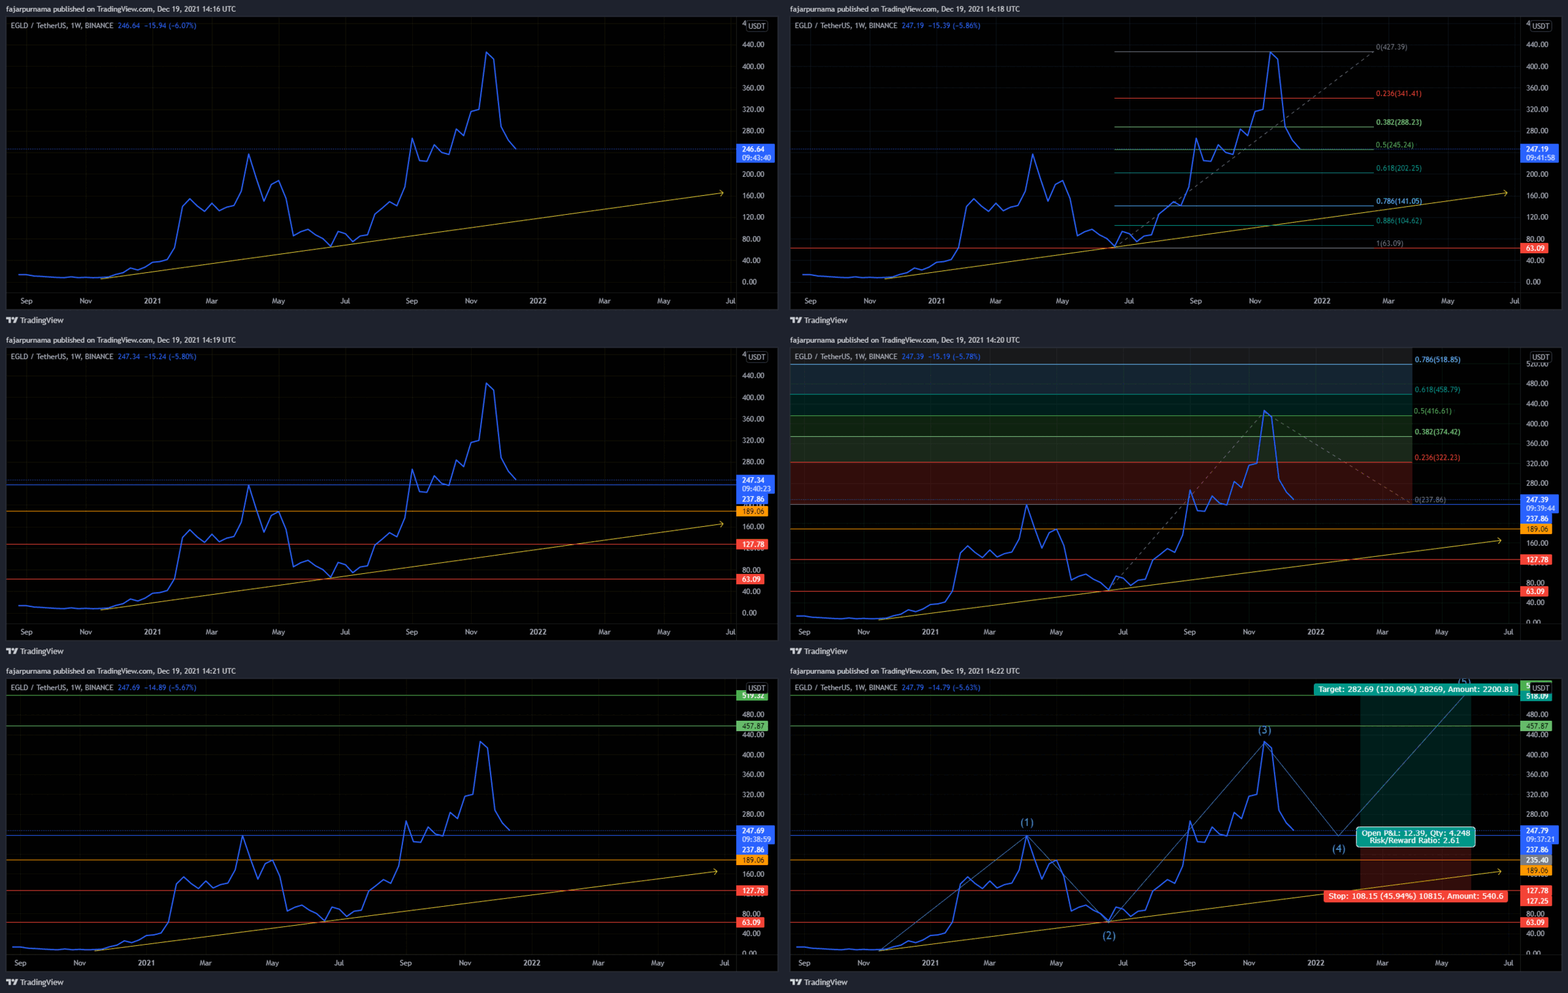
Elrond’s chart looks similar to Ethereum and Binance Smart Chain.
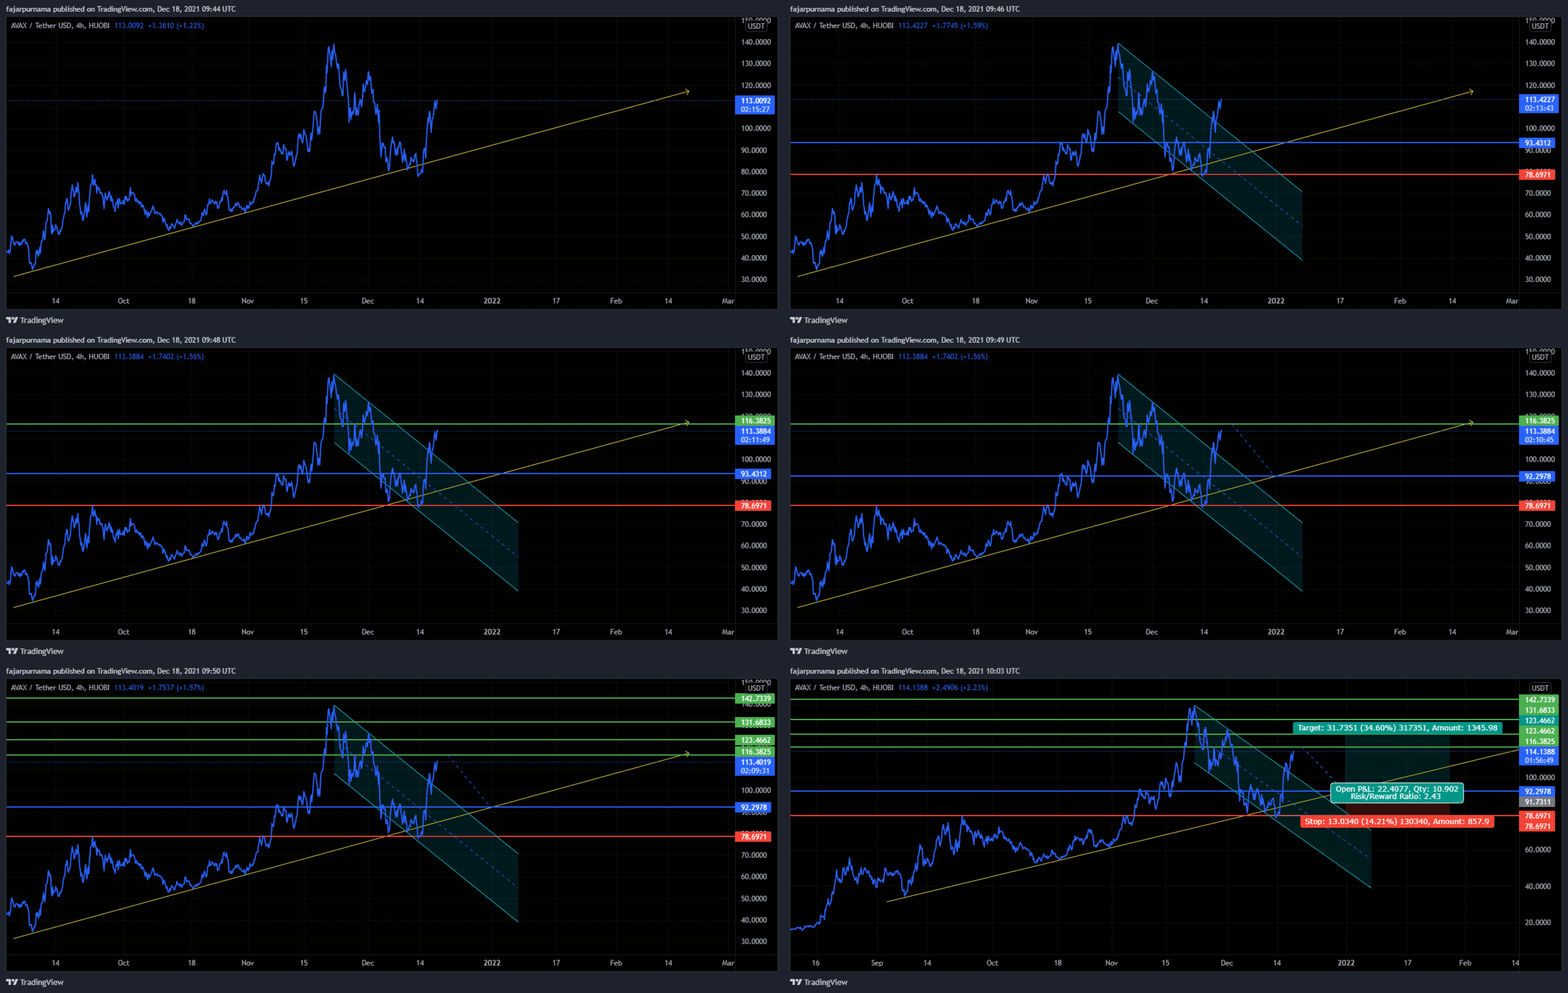
In Avalanche, the price broke the trend line but immediately returned above it. Although imperfect, but there is a possibility of bullish flag and currently broken up. There is a risk that the price may return inside the bullish flag, but often the price will correct only up to above the flag, coincidently above the supply and demand area as well, and continue bullish trend. In this case, it is recommended to stop loss when the trend line is broken.
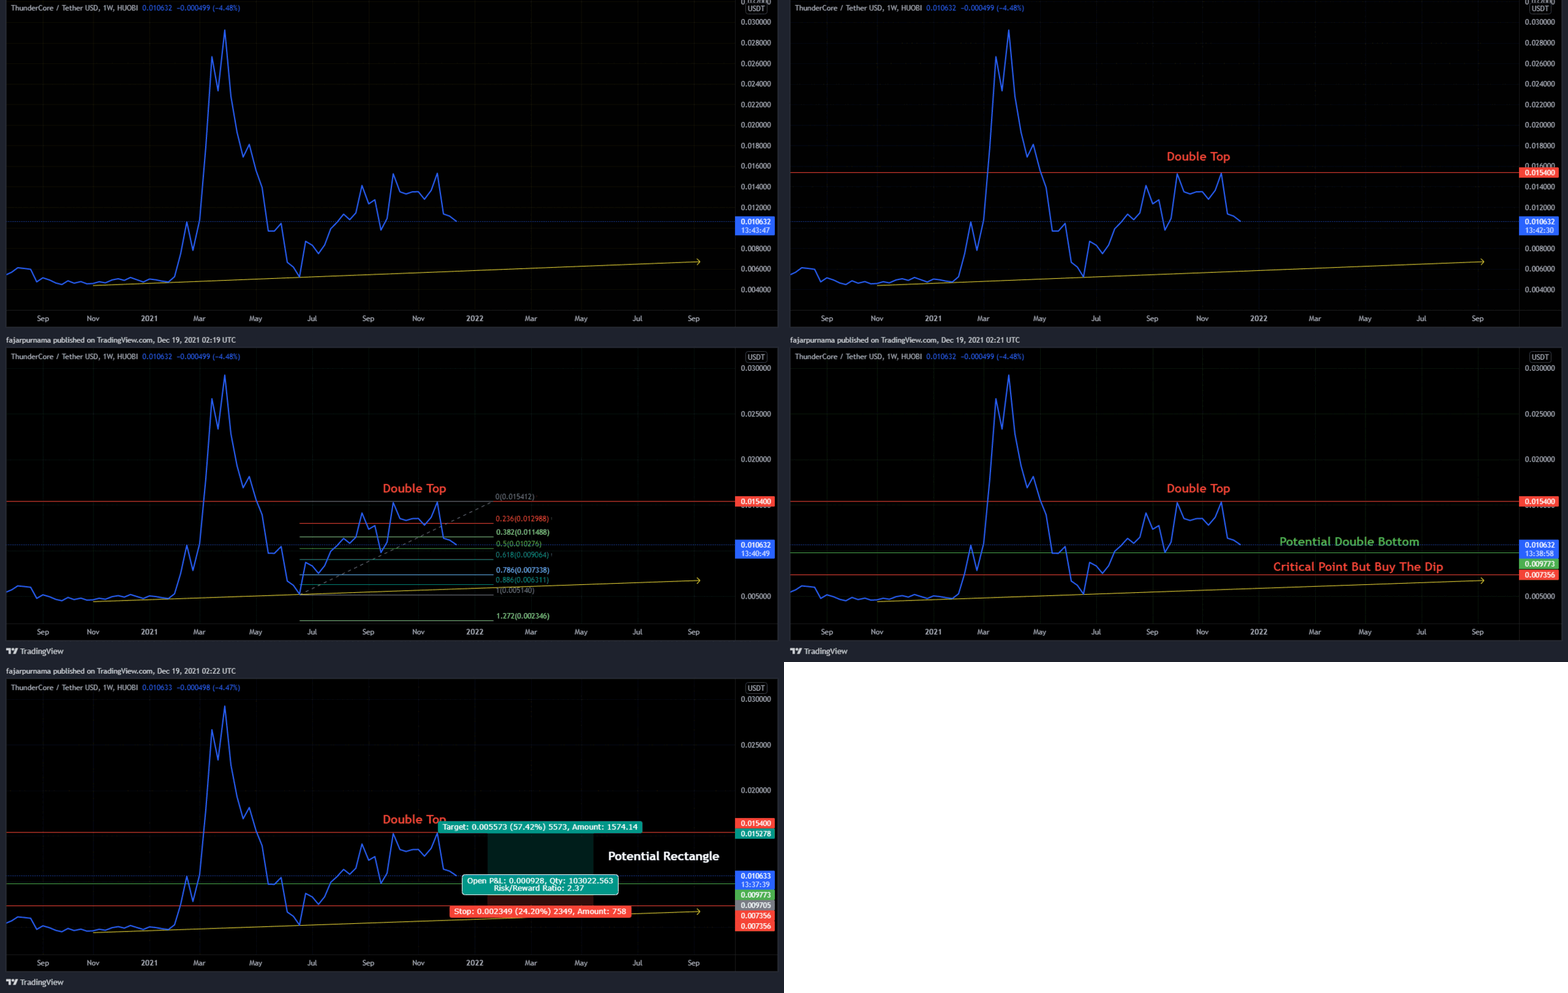
The price of Thunder Core rejects and risks a double top but remember Bitcoin in June 2021? Bitcoin also double tops but after that, double bottoms, and double tops again formed a rectangle pattern. I personally recommend avoiding taking high risk and little by little buying the dips instead as the trend line is low.
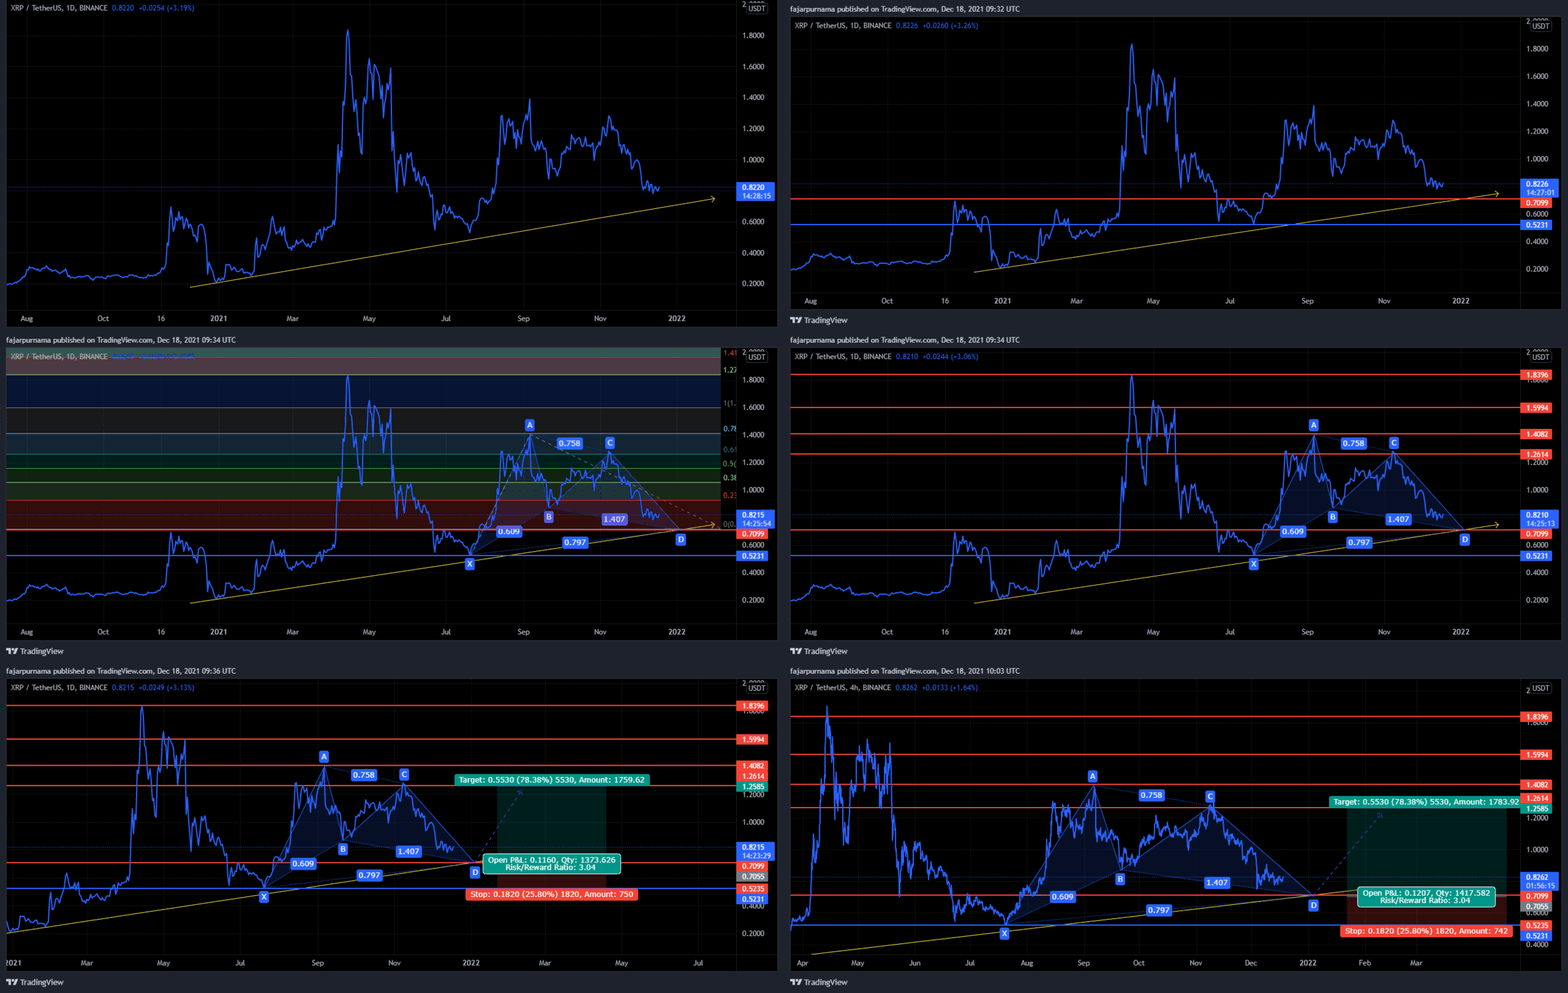
The basic technical analysis in Ripple Coin is to buy the dip if the price touches the trend line and coincidently above the supply and demand area as well. If the price really bounces on that point, then a bullish Gartley can potentially form. If you can take the risk, then stop loss below the supply and demand area or else, stop loss only as much as you can handle because if the price falls just a few percentage below that point can invalidate the bullish Gartley.
Disclaimer
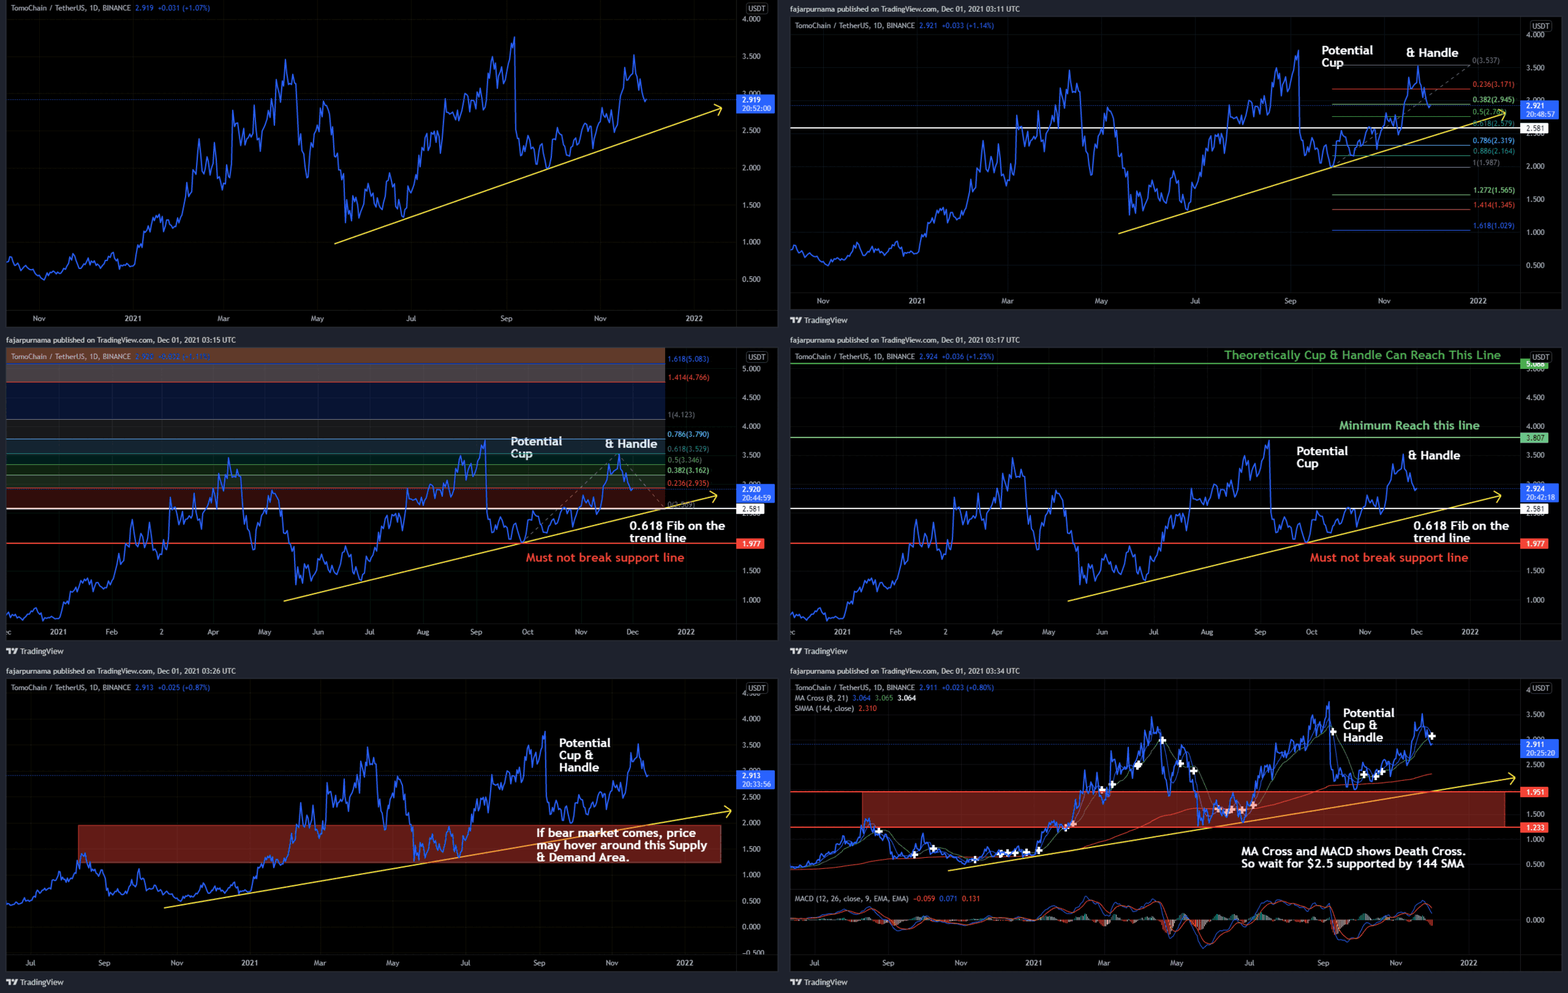
The newer the asset and/or the lower the market capitalization and/or the uneven the distribution of the supply, the less applicable the technical analysis. I can claim that based on my experience as a gem hunter where I only consider assets under $10 million market capitalization that I do not need technical analysis. All I need is to do fundamental and sentiment analysis (do my own research) and find any low market capitalization assets that may survive at least one year, then it is a guarantee big profit. As I am a gem hunter, I have less experience in technical analysis but I have to write these theories anyway before I forget which I obtained from my technical analysis course and for me to review. This initial version will remain free. If I ever become very professional in trading, then I will update these materials but ofcourse will be premium. Take the theories but create your own analysis style and risk the loss if following me blindly such as following my technical analysis on Tomochain. Therefore, try demo trading first and if it works for you, then you may move to real trading. Finally, this is not financial advice where my rules are:
- It is never my fault.
- Any losses occurred on your side, do not forget rule number 1. It is not my fault but it is your fault for following me.
- Therefore, it is very highly recommended to do your own research (DYOR) like I wrote before “take the theories but create your own analysis style”.
- Do not trade more than you can afford to lose.
Mirrors
- https://www.publish0x.com/cryptocurrency-101-for-users/intermediate-financial-technical-analysis-even-in-crypto-xznexqg?a=4oeEw0Yb0B&tid=github
- https://0darkking0.blogspot.com/2021/12/intermediate-financial-technical.html
- https://0fajarpurnama0.medium.com/intermediate-financial-technical-analysis-even-in-crypto-9e625f746987
- https://0fajarpurnama0.github.io/cryptocurrency/2021/07/03/fta-crypto-intermediate
- https://hicc.cs.kumamoto-u.ac.jp/~fajar/cryptocurrency/fta-crypto-intermediate
- https://steemit.com/cryptocurrency/@fajar.purnama/intermediate-financial-technical-analysis-even-in-crypto?r=fajar.purnama
- https://leofinance.io/@fajar.purnama/intermediate-financial-technical-analysis-even-in-crypto?ref=fajar.purnama
- https://blurt.blog/cryptocurrency/@fajar.purnama/intermediate-financial-technical-analysis-even-in-crypto?referral=fajar.purnama
- https://0fajarpurnama0.wixsite.com/0fajarpurnama0/post/intermediate-financial-technical-analysis-even-in-crypto
- http://0fajarpurnama0.weebly.com/blog/intermediate-financial-technical-analysis-even-in-crypto
- https://read.cash/@FajarPurnama/intermediate-financial-technical-analysis-even-in-crypto-06d2f9af
- https://www.loop.markets/intermediate-financial-technical-analysis-even-in-crypto/
- https://www.floyx.com/article/0fajarpurnama0/the-basics-of-financial-technical-analysis-even-in-000113f7ae
- https://markethive.com/0fajarpurnama0/blog/intermediatefinancialtechnicalanalysisevenincrypto