Finding Periods in Signal Equation Through Visualization
Get 1000000 0FP0EXP Token to remove widget entirely!
Get 500000 0FP0EXP Token to remove my NFTS advertisements!
Back in high school and university in department of science and mathematic, it is compulsory to solve mathematical problem manually using theories through formulas. However in Engineering, it is the application that is important, and thus we are encouraged not to waste time solving manually and instead use simulators such as Matlab, Octave, and today there are online ploters. For example in one of my assignments in Signal and System Analysis course, I was asked to find periods in signal equations through visualization rather solving through formulas. Period is defined as a complete cycle.

x(t)=cos(2t+π/4), Period = π

x(t)=(cos(t))2, Period = π

x(t)= ejπt, Period = 2

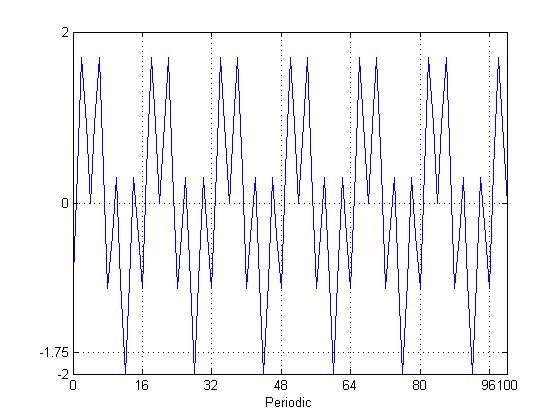
x[n]=cos((πn2)/8), Period = 8
x[n]=cos[πn/4]+sin[πn/8]-2cos[πn/2], Period = 16
Mirrors
- https://www.publish0x.com/fajar-purnama-academics/finding-periods-in-signal-equation-through-visualization-xvwmjln?a=4oeEw0Yb0B&tid=github
- https://0darkking0.blogspot.com/2021/01/finding-periods-in-signal-equation.html
- https://0fajarpurnama0.medium.com/finding-periods-in-signal-equation-through-visualization-71e601a904a4
- https://0fajarpurnama0.github.io/bachelor/2020/08/07/period-signal-eqation-visualization
- https://hicc.cs.kumamoto-u.ac.jp/~fajar/bachelor/period-signal-eqation-visualization
- https://steemit.com/engineering/@fajar.purnama/finding-periods-in-signal-equation-through-visualization?r=fajar.purnama
- https://stemgeeks.net/engineering/@fajar.purnama/finding-periods-in-signal-equation-through-visualization?ref=fajar.purnama
- https://blurt.buzz/@fajar.purnama/finding-periods-in-signal-equation-through-visualization?referral=fajar.purnama
- https://0fajarpurnama0.wixsite.com/0fajarpurnama0/post/finding-periods-in-signal-equation-through-visualization
- http://0fajarpurnama0.weebly.com/blog/finding-periods-in-signal-equation-through-visualization
- https://0fajarpurnama0.cloudaccess.host/index.php/9-fajar-purnama-academics/181-finding-periods-in-signal-equation-through-visualization
- https://read.cash/@FajarPurnama/collection-of-my-mini-assignments-in-current-science-and-technology-in-japan-2016-course-115c08e0
- https://www.uptrennd.com/post-detail/finding-periods-in-signal-equation-through-visualization~ODUxNTcz