The Effect of FPS, Resolution and Bitrate Settings on the Resulting Throughput in the Adobe Flash Media Live Encoder Software
Note
This is an English translated of my assignment from undergraduate course regarding research writing where the point is taught that research writing consists mostly of Abstracts, Introduction, Literature Reviews, Research Methods, Discussion, Conclusion, and Bibliography. Even though this course teaches in more detail about the contents of each chapter, at that time I was not able to fully reflect the details in this assignment.
Abstract
Logically, the resolution and fps settings in the streaming video should have an effect on the amount of throughput. But in the Adobe Flash Media Live Encoder software there is a bitrate setting, this is what affects the amount of throughput. Resolution and fps (frames per second) seem to have an effect on bitrate. This research is proof that the statement is true. In the future, besides knowing the throughput generated from various settings in the Adobe Flash Media Live Encoder software, the appropriate settings will be obtained.
This study uses two computers connected to the same network. The first computer does video steaming over the second computer, which measures the throughput produced by the first computer. The software used to measure throughput is Wireshark. Throughput measurements are carried out at various resolutions, fps (frames per second), and bitrate. Then the average throughput of the various resolutions, fps, and bitrates will be compared.
From the research results, it is proven that the average throughput produced is in accordance with the bitrate setting. There was no visible impact from the resolution and fps settings.
1 Introduction
1.1 Background
Video quality such as image pixel size and fps (frames per second) affects throughput. The bigger the image pixel, the bigger the data frame sent. Likewise with fps. A web cam has been installed in the Computer Lab, Department of Electrical Engineering, Udayana University. Installation of a web cam to show lab activities via the web. In fact, the resulting throughput with various settings for fps (frames per second), resolution and bitrate is not known. In this study, the resulting throughput will be observed with various settings for fps (frames per second), resolution, and bitrate using the Wireshark software.
1.2 Problem
How is the resulting throughput with a variety of settings for fps (frames per second), resolution, and bitrate?
1.3 Research Objective
Knowing the effect of FPS (frames per second), resolution and bitrate settings on the resulting throughput of the Adobe Flash Media Live Encoder software.
1.4 Research Benefit
- Find out the network throughput with various settings.
- Can choose the settings according to the network quality provided.
- Can optimize the use of video streaming in the computer lab, Electrical Engineering, Udayana University.
1.5 Scope and Limitation of the Problem
- Using adobe flash media live encoder software on Windows 7.
- Analyze throughput using wireshark on Linux Backtrack 5 R3.
- Only measures throughput.
- Compression using the H.264 standard.
- Testing in the computer lab, Electrical Engineering, Udayana University, on Tuesday, 12:30 WITA - 16:00 WITA, 18 December 2012, and Thursday, 13:00 WITA - 14:00 WITA, 20 December 2012.
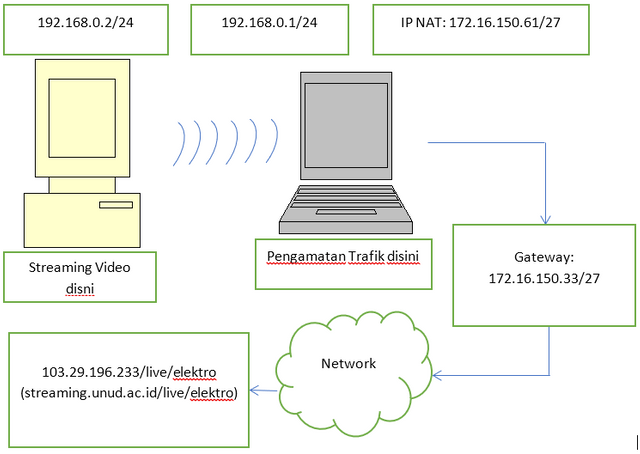
- The media server is 103.29.196.233/live/elektro (streaming.unud.ac.id/live).
2 Literature Review
2.1 Throughput
Throughput is the amount of data sent divided by the time required for large data to arrive at its destination in 1-way communication. Throughput is measured in bits / second or bytes / second (Gómez, 2005).
Applications such as VOIP (voice over IP) and video are sensitive to delay and jitter. Delay is the time it takes for a packet to be sent from origin to destination. Jitter is a variation of delay. Applications like this require a small delay (approx. 150 milliseconds). Therefore throughput must be guaranteed from origin to destination (Farrel, 2009).
2.2 RTP (Real-Time Transport Protocol)
RTP is a transport protocol for real-time applications. Real-time applications include audio and video conferencing, live video distribution, shared workspaces, remote medical diagnosis, telephony, command and control systems, distributed interactive simulations, games, and real-time monitoring.
With the development of high speed LAN (Local Area Network) and WAN (Wide Area Network) it is possible for real-time based applications to run on IP (Internet Protocol) based networks. The thing that is generally considered in real-time based applications is timing. Where the timing of receiving the package must match the timing of the package delivery. Therefore delay and throughput are common measures of quality (Stallings, 1998).
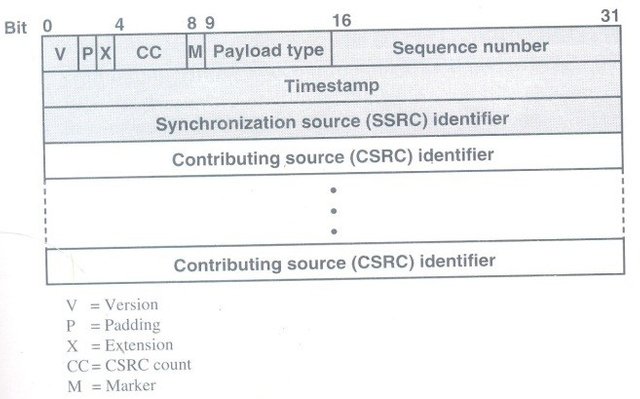
Figure 2.1 RTP header (Stallings, 1998)
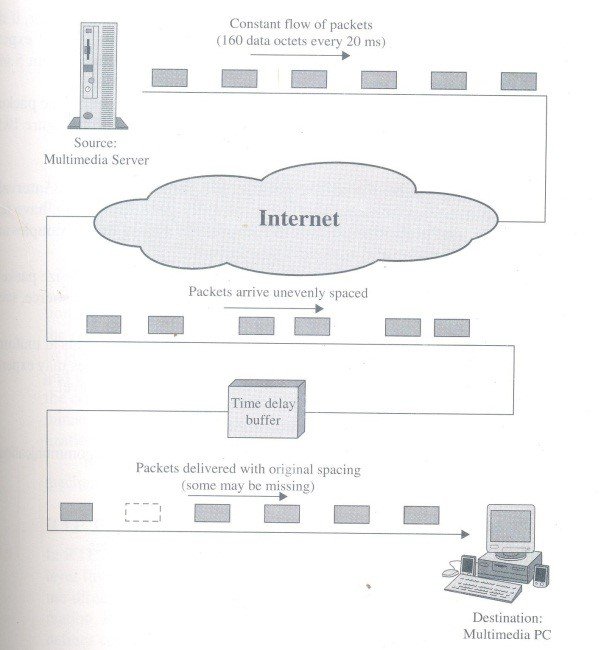
Figure 2.2 Traffic in Realtime protocol (Stallings, 1998)
2.3 Adobe Flash Media Live Encoder
Is a media encoder software that can capture audio and video as well as stream video and audio to Adobe Media Server or Flash Video Streaming Service (FVSS) in real-time. This software is able to broadcast live activities such as sports, concerts and others. (Adobe, 2013).
2.3 Wireshark
Wireshark is a world-renowned network protocol analyzer software. Can also capture traffic on a computer network. This software is the de facto (and often said de jure) standard from various industries and educational institutions. Wireshark was developed by many networking experts around the world and is an ongoing project from 1998 (Combs, 2013).
3 Research Method
3.1 Tools Used
Below is a list of tools to use:
| NO | Tool | Specification |
|---|---|---|
| 1 | Laptop ACER | Intel® Pentium® dual – core processor T4200 (2.0 GHz, 800 MHz FSB, 1 MB L2 cache) |
| Mobile Intel® Graphics Media Accelerator 4500MHD | ||
| 1GB DDR2 | ||
| 128 WXGA Acer CrystalBriteTM LCD | ||
| 250GB HDD | ||
| Realtek Semiconductor Co., Ltd. RTL8111/8168B PCI Express Gigabit Ethernet Controller | ||
| Atheros Communications Inc. AR928X Wireless Network Adapter | ||
| Operating System Linux Backtrack 5 R3 | ||
| 2 | PC | Intel® Pentium® core-duo processor |
| 1GB DDR2 | ||
| 256 VGA | ||
| AWUS036NHA 802.11b/g/n Long-Range USB Adapter | ||
| Alcor Micro, Corp. USB 2.0 PC Camera | ||
| Operating System Windows 7 Ultimate | ||
| 3 | Software | Adobe Flash Media Live Encoder 3.2 |
3.2 Steps
First, the tool is designed as follows:
Figure 3.1 Research design
Second, start the packet capture with the Wireshark software on the laptop. The captured packet is on the wireless LAN.
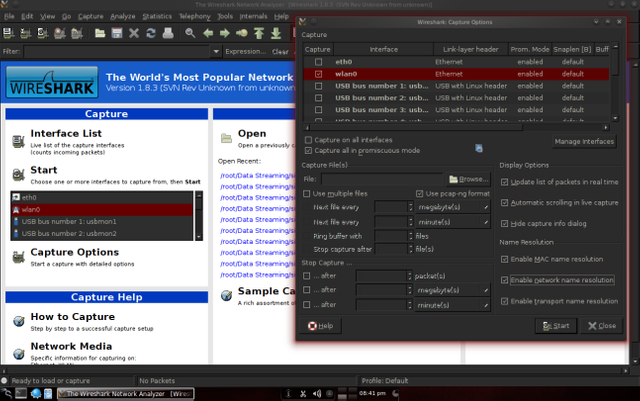
Figure 3.2 Selection of wlan0 interface for captured packets
Packet capture is filtered so that it only captures packets sent by streaming video, namely 192.168.0.2.
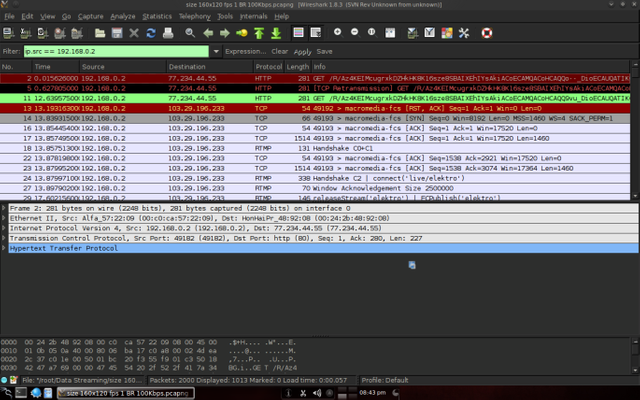
Figure 3.3 Entering the filter command ip.src == 192.168.0.2
To see the throughput, the statistics menu is selected then IO graph is selected.
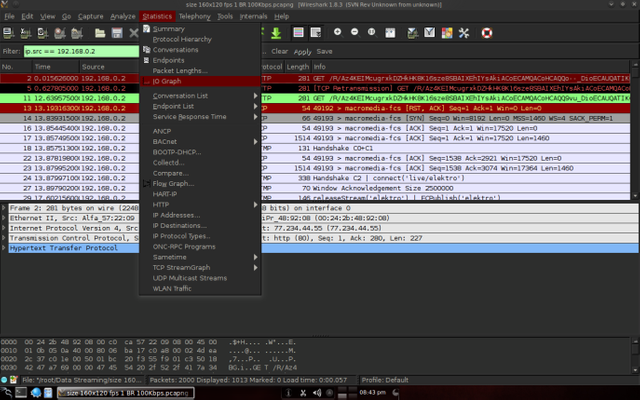
Figure 3.4 Selection of IO Graph
As with packet capture, it is filtered to see only bits passing from 192.168.0.2.
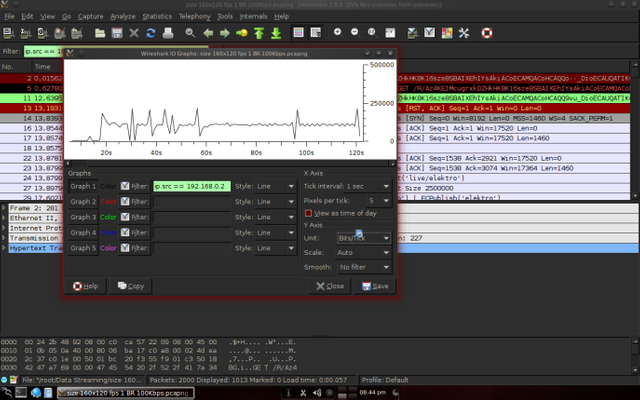
Figure 3.5 Graph of the throughput of 192.168.0.2
Third, start streaming the video with the Adobe Flash Media Live Encoder software with the settings adjusted to the problem statement.
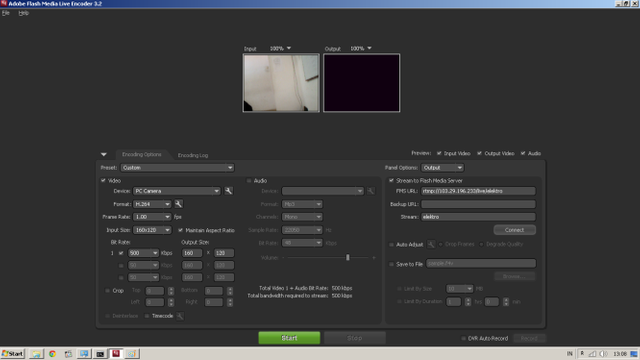
Figure 3.6 Video streaming settings on the Adobe Flash Media Live Encoder
Fourth, after 2 minutes the streaming is stopped. Sixth, packet capture on Wireshark is stopped and the results are saved. Seventh, return to the second step with the third step of a different arrangement (proceeding from the problem formulation). If all settings have been tried then the data search is complete.
3.3 Data Analysis
By using the Wireshark software, throughput can be seen in graphical form. The horizontal axis shows the time in seconds while the vertical axis shows data in bits.

Figure 3.7 Throughput with 160x120 fps resolution setting 1 bitrate 100Kbps

Figure 3.8 Throughput with 160x120 fps 1 bitrate 350Kbps resolution settings

Figure 3.9 Throughput with 160x120 fps 1 bitrate 500Kbps resolution settings

Figure 3.10 Throughput with a resolution setting of 160x120 fps 5 bitrate 100Kbps

Figure 3.11 Throughput with a resolution setting of 160x120 fps 5 bitrate 350Kbps

Figure 3.12 Throughput with a resolution setting of 160x120 fps 5 bitrate 500Kbps

Figure 3.13 Throughput with a resolution setting of 160x120 fps 10 bitrate 100Kbps

Figure 3.14 Throughput with a resolution setting of 160x120 fps 10 bitrate 350Kbps

Figure 3.15 Throughput with a resolution setting of 160x120 fps 10 bitrate 500Kbps

Figure 3.16 Throughput with a resolution setting of 320x240 fps 1 bitrate 100Kbps

Figure 3.17 Throughput with a resolution setting of 320x240 fps 1 bitrate 350Kbps

Figure 3.18 Throughput with a resolution setting of 320x240 fps 1 bitrate 500Kbps

Figure 3.19 Throughput with a resolution setting of 320x240 fps 5 bitrate 100Kbps

Figure 3.20 Throughput with a resolution setting of 320x240 fps 5 bitrate 350Kbps

Figure 3.21 Throughput with a resolution setting of 320x240 fps 10 bitrate 100Kbps

Figure 3.22 Throughput with a resolution setting of 320x240 fps 10 bitrate 500Kbps
4 Results and Discussion
4.1 Proof
Proof that the average throughput is the same as the bitrate setting can be seen in the following table:
| NO | Resolution | FPS | Bitrate | Average throughput |
|---|---|---|---|---|
| 1 | 160x120 | 1 | 100 Kbps | 100 Kbps |
| 2 | 160x120 | 5 | 100 Kbps | 100 Kbps |
| 3 | 160x120 | 10 | 100 Kbps | 100 Kbps |
| 4 | 160x120 | 1 | 350 Kbps | 350 Kbps |
| 5 | 160x120 | 5 | 350 Kbps | 350 Kbps |
| 6 | 160x120 | 10 | 350 Kbps | 350 Kbps |
| 7 | 160x120 | 1 | 500 Kbps | 500 Kbps |
| 8 | 160x120 | 5 | 500 Kbps | 500 Kbps |
| 9 | 160x120 | 10 | 500 Kbps | 500 Kbps |
| 10 | 320x240 | 1 | 100 Kbps | 100 Kbps |
| 11 | 320x240 | 5 | 100 Kbps | 100 Kbps |
| 12 | 320x240 | 10 | 100 Kbps | 100 Kbps |
| 13 | 320x240 | 1 | 350 Kbps | 350 Kbps |
| 14 | 320x240 | 5 | 350 Kbps | 350 Kbps |
| 15 | 320x240 | 10 | 350 Kbps | 350 Kbps |
| 16 | 320x240 | 1 | 500 Kbps | 500 Kbps |
| 17 | 320x240 | 5 | 500 Kbps | 500 Kbps |
| 18 | 320x240 | 10 | 500 Kbps | 500 Kbps |
5 Closing
5.1 Conclusion
From the experimental results, it is evident that the average throughput is fully influenced by the bitrate setting. Even though the resolution settings are 160x120, 320x240 and fps 1, 5, 10, if the bitrate is set to 100Kbps then the average throughput is 100Kbps, the bitrate setting is 350Kbps, the average throughput is 350Kbps, the bitrate setting is 500Kbps then the average throughput is 500Kbps and so on.
5.2 Future Work
Although the average throughput is the same as the resulting graphics bitrate setting varies with different resolution and fps settings. From this study, the real resolution and fps were not observed. Delay, jitter, or parameters other than throughput are not examined in this article. These things can be used as further research from this research. The software being researched was the Adobe Flash Media Live Encoder, so it could do research again using other software.
Bibliography
- Farrel, A. 2009. Network Quality of Service. Burlington : Maurgan Kaufmann.
- Gómez, G. 2005. End-to-End Quality of Service over Cellular Networks. Chichester : John Wiley & Sons Ltd.
- Stallings, W. 1998. High-Speed Networks TCP/IP and ATM Design Principle. New Jersey : Prentice-Hall, Inc.
- Adobe, 2013. http://www.adobe.com/products/flash-media-encoder.html, accessed tanggal 17 Desember 2013.
- Combs, G. 2013. http://www.wireshark.org/about.html, accessed 17 Desember 2013.
Mirror
- https://www.publish0x.com/fajar-purnama-academics/the-effect-of-fps-resolution-and-bitrate-settings-on-the-res-xwnlrnj?a=4oeEw0Yb0B&tid=github
- https://0fajarpurnama0.github.io/bachelor/2020/11/09/fps-bitrate-throughput-adobe-flash-media-live-encoder-assignment
- https://0fajarpurnama0.medium.com/the-effect-of-fps-resolution-and-bitrate-settings-on-the-resulting-throughput-in-the-adobe-flash-134e2f3d833c
- https://hicc.cs.kumamoto-u.ac.jp/~fajar/bachelor/fps-bitrate-throughput-adobe-flash-media-live-encoder-assignment
- https://blurt.world/blurtech/@fajar.purnama/the-effect-of-fps-resolution-and-bitrate-settings-on-the-resulting-throughput-in-the-adobe-flash-media-live-encoder-software?r=fajar.purnama
- https://0darkking0.blogspot.com/2020/11/the-effect-of-fps-resolution-and.html
- https://hive.blog/technology/@fajar.purnama/the-effect-of-fps-resolution-and-bitrate-settings-on-the-resulting-throughput-in-the-adobe-flash-media-live-encoder-software?r=fajar.purnama
- https://0fajarpurnama0.cloudaccess.host/index.php/9-fajar-purnama-academics/94-the-effect-of-fps-resolution-and-bitrate-settings-on-the-resulting-throughput-in-the-adobe-flash-media-live-encoder-software
- https://steemit.com/computers/@fajar.purnama/the-effect-of-fps-resolution-and-bitrate-settings-on-the-resulting-throughput-in-the-adobe-flash-media-live-encoder-software?r=fajar.purnama
- http://0fajarpurnama0.weebly.com/blog/the-effect-of-fps-resolution-and-bitrate-settings-on-the-resulting-throughput-in-the-adobe-flash-media-live-encoder-software
- https://0fajarpurnama0.wixsite.com/0fajarpurnama0/post/the-effect-of-fps-resolution-and-bitrate-settings-on-the-resulting-throughput-in-the-adobe-flash-me
- https://read.cash/@FajarPurnama/fps-resolution-bitrate-settings-effect-on-throughput-in-the-adobe-flash-media-live-encoder-software-77e7904f
- https://www.uptrennd.com/post-detail/the-effect-of-fps-resolution-and-bitrate-settings-on-the-resulting-throughput-in-the-adobe-flash-media-live-encoder-software~ODA0NzI1
