Hand Carry Data Collecting Through Questionnaire and Quiz Alike Using Mini-computer Raspberry Pi
Note
- This paper was presented in The 4th International Mobile Learning Festival (IMLF) at Honk Kong, SAR China, on 10th June 2017.
- I do not remember transferring copyright. If I’m correct, the copyright remained with both me “Fajar Purnama” the main author and IMLF2017 proceeding where I have the authority to repost anywhere and I hereby declare to license it as customized CC-BY-SA where you are also allowed to sell my contents but with a condition that you must mention that the free and open version is available here. In summary, the mention must contain the keyword “free” and “open” and the location such as the link to this content.
- However, please also support IMLF proceedings by visiting their website http://imlf.mobi/ where you can download not only mine, but all proceedings for free by clicking the download button and registering your email.
- The presentation is available at Slide Share.
Abstract
Conventionally data collecting through surveys or quizzes are usually done by distributing hard paper based questionnaires or by directly asking people themselves. With the invention of the Internet, the base of these methods changes to online. For example, in a high developed information communication technology (ICT) University, the authorized personnels sends emails to students to complete an online questionnaire resided on a certain website. However, in most cases on developing countries such as the ones resided in South East Asia, the people are already familiar with computer devices such as gadgets, laptops, netbooks, etc, but they do not have a reliable Internet connection. Therefore this work proposes a method which utilizes this situation that can improve the convenience of survey process for both the surveyors and participants. Since most people have gadgets, our method involves in providing a portable hotspot device for them to connect and access our local survey questionnaire website. This is possible thanks to the invention of credit card size computer such as Raspberry Pi. Like any other computer it can be filled with an operating system (OS), installed with a hotspot module and a webserver which are enough to conduct surveys or quizzes alike through wireless local area network (WLAN) except that the size is hand carry which is easier to carry than laptop. In this work the method is realized and was put to few trials. This research is more of mobile on surveyors’ or teachers’ side than mobile learning on students’ side.
Introduction
There are many forms of data collecting, for example questionnaires which their results are used to create statistical analysis like finding the students’ and teachers’ perspective of elearning like in some of our peers’ research Paturusi (2015) and Monmonthe (2016) where they are needed to determine the e-readiness in their respective researched Universities. In classrooms, quizzes are more used to access the knowledge of the students of which parts of the subject that were clearly understood and which parts were not. Quizzes also have other benefits like stimulating the learning process of the students which can guide them in learning the subject and help them in performing better in exams as discussed on McDaniel (2012) where they performed experiments on different type of quizzing such as repetitive quizzing with item identical to exams with only related to exams, and providing feedbacks after quizzes. Both questionnaires and quizzes serves as a purpose for information gathering.
Unfortunately, these are not what wanted to be discuss here. What wanted to be discussed is the method or process of conducting the data collecting or survey. The methods of our peers were still quite conventional, by distributing paper questionnaires and recollecting them back, while the others uses online method that utilizes computer and Internet connection which is currently one of the easiest way. However in most developing countries such as in South East Asia, Internet connection is not well established The World Bank Group (2016), meaning that online survey is not the answer, like in Indonesia for example Kusumo (2012) which forces our peers to use the conventional method. However most people there are familiar and owns computer devices such as gadgets, androids, and iphones The World Bank Group (2016) and this research tries to utilize that situation which aims to be more convenient than the conventional method. Since computers are utilized the method will also have the advantage of online survey which is the convenience of having automated data collection Wright (2005).
This topic can be said more of mobile on the surveyors’ or teachers’ side than the typical mobile learning on the students’ side. The method proposed is to use a portable server where the users’ computer devices can connect to and perform the survey there. The data obtained will be stored on that miniserver and later be extracted by the surveyors with ease, also it is possible to program a preprocessing on that miniserver which can make things more easier. This idea can easily be realized since the invention of a credit card size computer Raspberry Pi (there are other brands as well but for now this one is used). All that is needed is to program this Raspberry Pi by inserting an OS, installing a hotspot module where the users will connect through WLAN, and a local website for the survey materials itself. After this idea was realized, a small trial was conducted on few users. More importantly the advantages of this method was shown and discussed, on the other hand also the limitations of this method based on resource consumptions.
Related Work
There are other researches that had similar situation to this one where people have there own computer device but insufficient infrastructure in their respective places to connect to The Internet. Most of these researches shows making things portable as the answer. Here are some related works:
- The work of Royyana (2010) proposed to make an online quiz to be portable where the students can take home using their computer devices and attempts them offline, later on the online system will be synchronized once the students come across a reliable Internet connection.
- Kuziek (2016) proposed a method using Raspberry Pi to be able to conduct Electroencephalography (EEG) experiments outside the laboratory, since it is not easy to get the naturality of the occurrence when EEG experiments are conducted inside the lab.
- An interesting work by Wittenberg (2015) proposes a use of keys which is a flash drive that contains a computer environment to run specialized software need for Computer Science courses. Since not many students are versed in programming, setting up their own environments, etc, flash drives already pre-installed with an OS, and softwares were distributed to students where the students can boot on any computer machines.
- This one O’Connor (2011) is similar to this work where they use laptops for collecting data for home visitation program where normally they use paper based questionnaires and input them into the database later. Using a laptop saves from that trouble and other costly stuffs like printing papers. The result showed reduced cost in money and time. The difference between this work is that this work will use a smaller size computer and targeted for mass size survey.
Materials and Methods
Device
The device used is a hand carry or a minicomputer which functions as a portable server. Table 1 shows the modules needed to execute the method on the next section and Table 2 is the specification of the minicomputer. Nowadays the price of Raspberry Pi ranges from $30 - $50. If not already owned items to configure the Raspberry Pi the following items can be purchased; high definition multimedia interface (HDMI) compatible display starting from $20, keyboard beginning at $5, mouse as cheap as $1, and power bank from $10.
| Specification |
|---|
| A 900MHz quad-core ARM Cortex-A7 CPU |
| 1 Giga Byte (GB) Random Access Memory (RAM) |
| 4 Universal Serial Bus (USB) ports |
| 40 General Purpose Input Output (GPIO) pins |
| Ethernet Port |
| Camera Serial Interface (CSI) |
| Display Serial Interface (DSI) |
| Micro Serial Digital (SD) card slot |
| Video Core IV 3D graphics cire |
| Items | Materials | Details |
|---|---|---|
| Computer: | Raspberry Pi 2 | The minicomputer. |
| Operating System: | Raspbian | Abbreviation for Raspberry Debian which is a Linux based OS for the Raspberry Pi itself. |
| Hotspot Module: | Hostapd | This is an application to start the wireless interface to server as hotspot for users to connect. |
| DHCP Server: | Udhcpd | Each connected devices needs to be assign an identity for the WLAN which is internet protocol (IP) address. |
| Webserver: | Apache2 | The questionnaire will be a web based where the connected users will use their browser to access it. This is used to host a local website. |
| Database Server: | MySQL | Using a structured query language (SQL) to store the data input by the users. |
| Landing Page using DNS server: | Dnsmasq and Iptables | Normally the users have to be told the address of the website of the questionnaire, but with this the browser will automatically redirect to it. |
| Survey Software: | Limesurvey | A content management system (CMS) used for online surveys. |
Method
This work is designed to give convenience and mobility to the surveyors and teachers alike to do their desired task which for now limited to only getting responses from others, for examples conducting quizzes to assess the students’ knowledge, and surveying the crowds to know their perspective. With the situation of limited Internet connection, the modern online survey is unusable, but with many ownership of computer devices, an easier way than the conventional paper based questionnaire becomes available. That method is the use of hand carry computer which functions as a portable server to gather data inputed from other users’ or participants computer device which can be connected and functions as a client illustrated on Figure 1. When conducting surveys, it is no longer needed to handover paper questionnaires, but only ask the people to connect to the device and answer the questions from their gadgets. It can be applied by surveyors to gather data on institutions, teachers who are giving quizzes to their students, surveyors who gather data from home to homes, or even by random persons on crowds in the public whether for commercial or personal use. Unlike the paper based, processing can be task on the device which eliminates the needs to manually inputing and process the survey data afterwards which also means results can be obtained instantly and accumulatively.
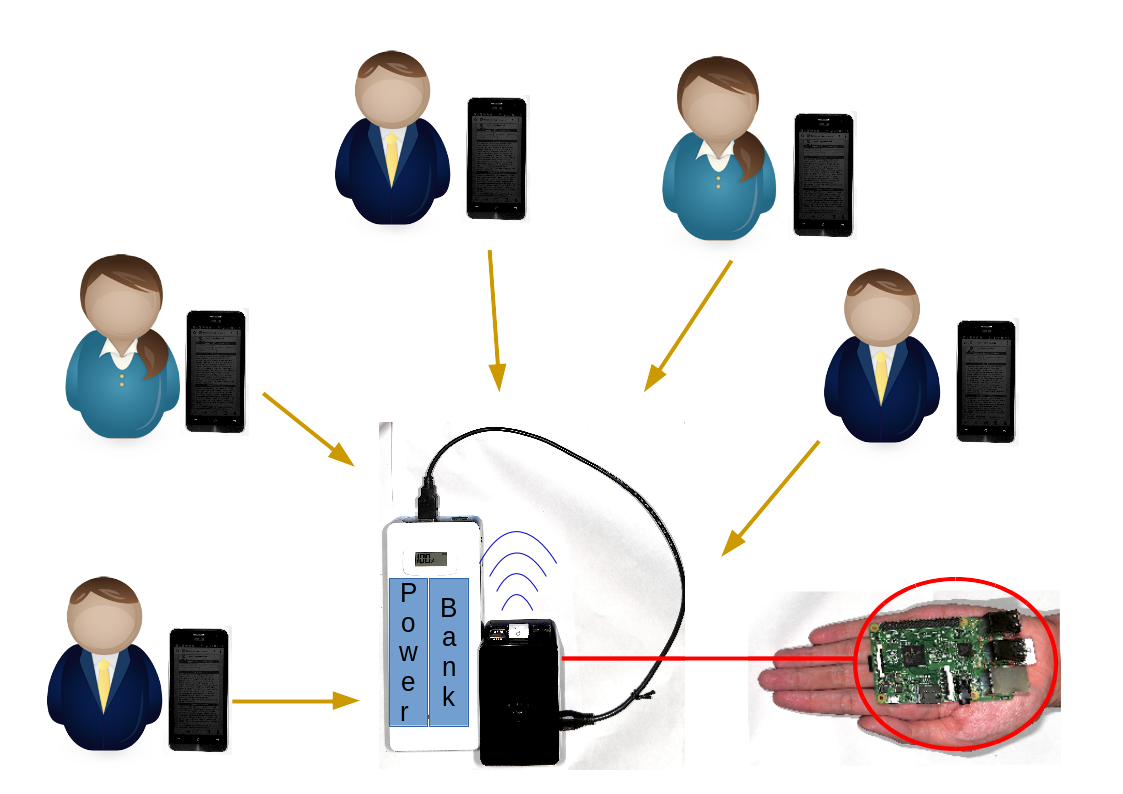
Figure 1. Illustration of using hand carry computer device to gather informations from other users inputed from their own computer device.
As described in the previous sub section, the hand carry device used is a Raspberry Pi. Raspbian OS is then flashed into this computer which is a Linux based OS. Required modules can be downloaded and installed from The Internet which the Raspberry Pi can connect from the wired or wireless interface. The first modules needed are means to connect users to this Raspberry Pi through wireless connection which will use the one based on IEEE 802.11. They are Hostapd to run the wireless interface as a hotspot and Udhcpd to give IP address to the clients attempting to connect. The second modules needed are means to host the questionnaires, quizzes, or alike which is web based on this work. Apache2 as the web server to show the electronic questionnaire and MySQL as the database server to store the inputed data from clients. In this work, CMS Limesurvey is used to manage the local questionnaires, a sample screenshot is available on Figure 2. The third modules is not essential but eases the clients on the attempting process which are DNS server Dnsmasq to resolve all domain name to the local survey website and Iptables to redirect if the server is connected to The Internet, simply they function as a landing page in order to automatically direct clients to the questionnaire’s location when they open their browsers. If not, we have to tell them beforehand and let them find the location manually. With all of this done the Raspberry Pi will function as a hand carry server.
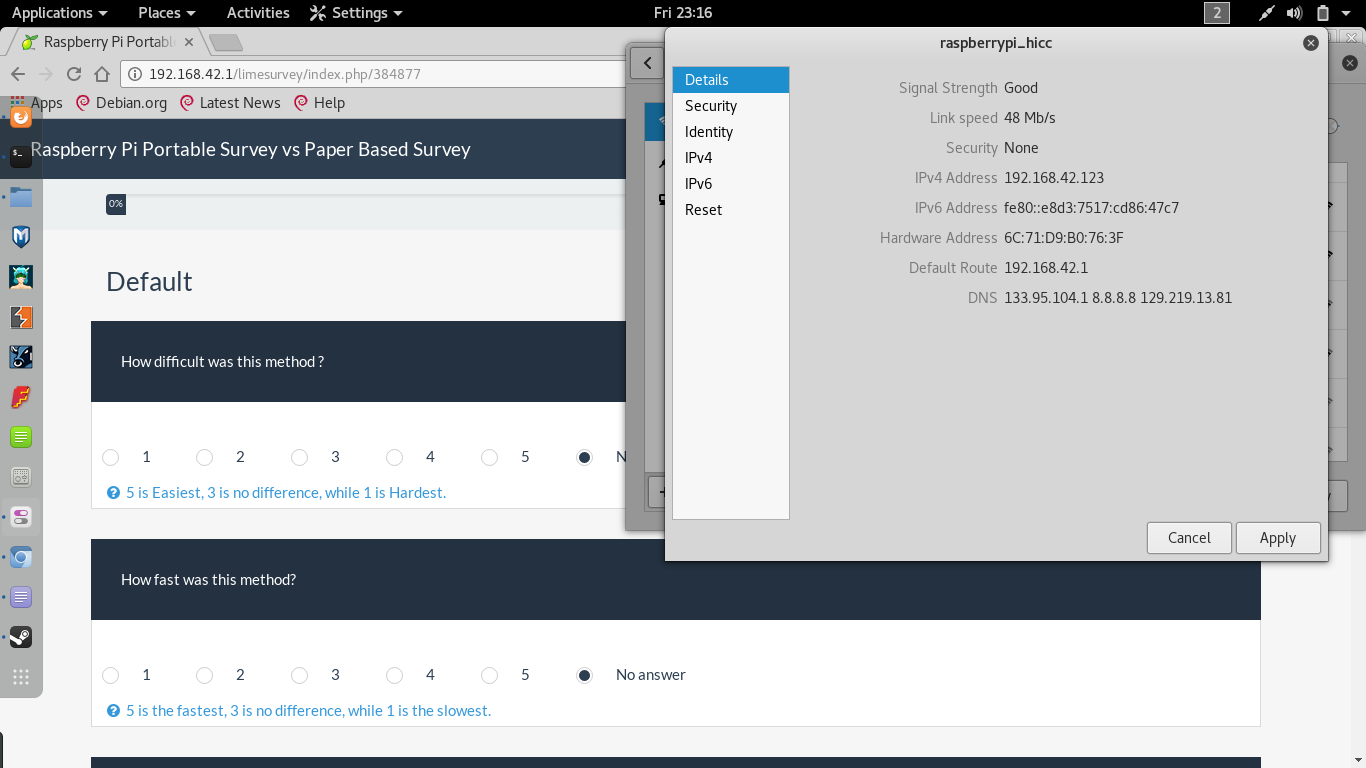
Figure 2. Screenshot of attempting a survey using this method where it can be seen the client connects through a hotspot and received an IP address 192.168.42.123 and the survey link resides on 192.168.42.1/limesurvey. This was attempted on a laptop but it is not much different on mobile.
Simulation
Small simulations or trials were carried where there was 1 surveyor and he surveyed 30 people simultaneously. The surveyor is one of our lab members name Elphas Lisalitsa, and it is also fortunate that he never heard of Raspberry Pi when we approached him, which is good that the feedback of using this method can be more objective. It is conditioned that the surveyor knew how to do this method including using Limesurvey CMS. Before conducting the trial the surveyors are trained to do this method which fortunately only took one time that only last few minutes, since it’s quite unfair that the surveyor is versed in computer literacy, meaning that he is already skilled in creating questionnaire using document editor softwares and printing them. As he is already versed in using Microsoft Word, Libreoffice Writer, and similar softwares it is fair that he should also be versed in using our method. Imagine if a person does not know how to use Libreoffice Writer, he/she will take a long time to make this questionnaire, which is the same story of not knowing to do this method.
The first experiment was the conventional one where they use paper based which the process includes writing 29 item questionnaires, printing them out, handing them to the participants, collecting them back, finally inputing them on the database. The second experiment is using our method which the process includes writing 29 item web based questionnaires, starting the device, asking the participants to connect and answer the questions. Due to some current limitations, field survey cannot be conducted but simulation with 29 virtual users provided and 1 real user attempted the survey on the Raspberry Pi. The same can be said for paper based where only distributing and collecting the papers are simulated with only single participants answering the questions. In the end the surveyor will be asked to compare the convenience of both methods. The questionnaire items were based on a survey of MOOC readiness survey in high schools and a national University in Mongolia containing 18 five point likert scale questions, 5 yes or no questions, 4 multiple choice questions, and 2 fill in question, also 633 words with 3628 characters. The survey was lead by our peer Otgontsetseg Sukhbaatar.
For further simulation, stress testing was conducted to see if it could handle up to one hundred users. Unfortunately as stated before that the authors did not have a real testing ground, instead a simulation is carried using Funkload a web stress testing application (Delbosc, 2017) from another powerful computer to simulate a hundred virtual users at the same time accessing and conducting the survey. The application was able to record the activities on the browser starting from accessing the survey, answering questions, then viewing current results, and later to be replayed in benchmarking mode to include more virtual users. CPU and memory usage, and power delivery were also measured, but more importantly the response time.
Result
Data Collection Process
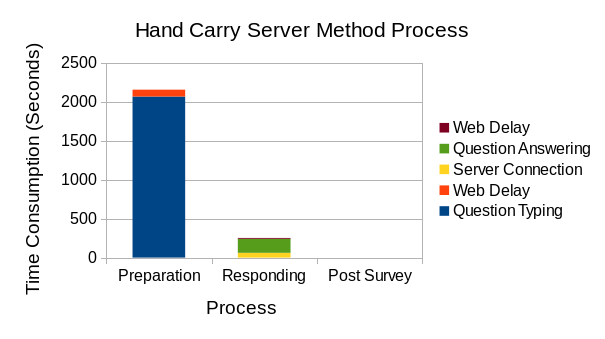
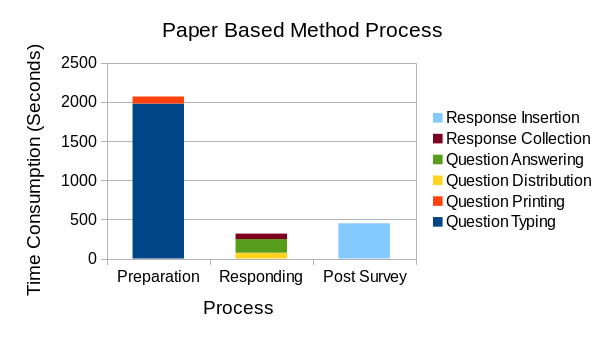
Figure 3. Time consumption of survey process from preparation, responding, to post survey. For paper based method the preparation consists of question typing and question printing, responding consists of question distribution, question answering, and response collection, and Post Survey consists of response insertion. For hand carry server method the preparation consists of question typing with web delays, responding consists of server connection, question answering with web delay, and the advantage of this method is no need for post survey which the response already automatically inserted.
Figure 3 shows the time consumption of both method showing little difference on preliminary and during data collection process. During the preliminary data collection process, the conventional method starts of by opening Libreoffice Writer, then writing 29 questions which took 33 minutes. Next printing the questionnaires of 3 pages for 30 people using OKI C332 fast printing machine which took as quickest of a second per page and everything took roughly 1 minute and 30 seconds assuming that it had the capabilities of automatic stampling. Using old printers may take much longer. Also the more the paper the heavier the weight, while Raspberry Pi only weights 45g.
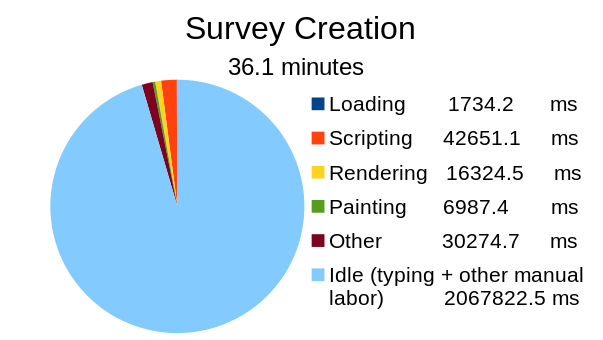
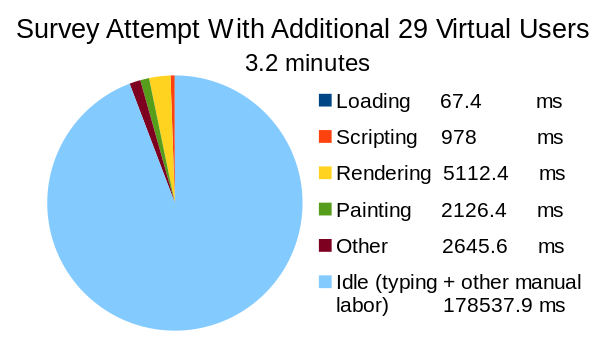
Figure 4. Time consumption captured during creating survey, and attempting survey on Raspberry Pi. Idle time can represent the time taken for typing, choosing, etc (manual labor), while others are web delay such as time to load a page and time to submit forms.
Making questionnaires on Raspberry Pi solely depends on what application was used, on this case is using Limesurvey LMS. The time consumptions can be divided into two which are typing the questions and delays from the web system with detailed data showed on Figure 4. Using developer tools available on all browsers the process of questionnaire creation can be monitored in detail. It can be summarize that delays from the web like loading and scripting took a minute and 28 seconds while typing the questions itself took 34 minutes and 27 seconds. For paper based the issue is the needs to produce hard copy which contributes time needed for printing, while for this method depends on the hardware and software capabilities of the server and/or client if chosen to work remotely. With greater capabilities it can lessen the web delays such as loading page, and vice versa that more lags will occur with lower capabilities.
For data collection process, it is the manual labor that is needed to be worried for paper based method which are distributing questionnaires and collecting them back while for Raspberry Pi based is dependent on its computer capabilities where the more the user, the more its performance degrades, more details are discussed on next subsection, also the capabilities of the client’s computer device influences. For paper based, distributing questionnaire took a minute 15 seconds and collecting them back took a minute 10 seconds. For this method the time to connect is a minute and 2 seconds and the web delay is 11 seconds tested for one user with 29 virtual users logged in (this result is highly related to Figure 6). As for answering the questions itself there is little difference where for paper based took 2 minutes and 54 seconds while for this method took 2 minutes and 59 seconds.
Finally the post data collecting process is where the advantage of this work’s method was shown. An extra process will have to be taken if using the conventional method which is inputting the data to the database. On Figure 3 is assuming the fastest semi-automatic way using machines which are a scanner to scan the answers and optical character reader (OCR) to read the answers to be automatically put into the database like on English tests or national examination tests which took 7 minutes and 30 seconds for 90 pages of responses (3 pages multiplied by 30 people), with our scanner Epson ES-H300 was able to handle 5 seconds per page. Thought most surveyor does not have this technology and manually types them one by one which can take a lot more time, also usually two people are assigned doing the exact same thing for which in the end their answers to be cross checked with each other to mitigate human errors. Note that this have not include generating graph like analysis.
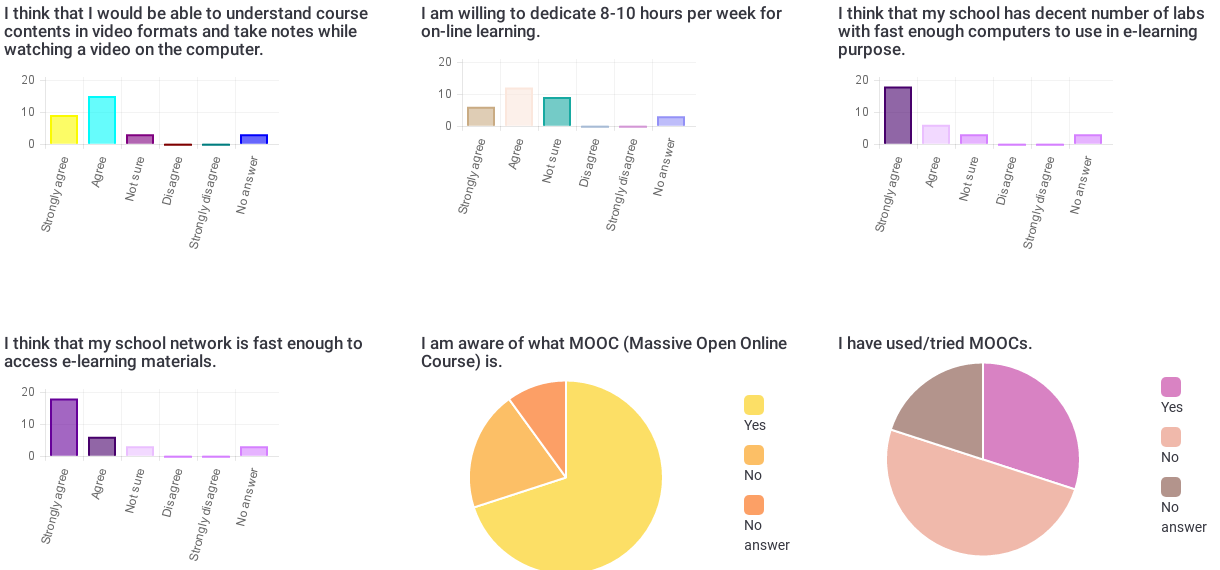
Figure 5. Data in form of bar graph and pie chart was shown the instance the hand carry server received the responses. Only 6/29 item result shown here since it is too much to show all.
Even so the hand carry server method surpasses those methods (whether manual or using machines like scanner) that can input and generate analysis with graphs the instance the participants answers the questionnaire. This made clicker possible to be implemented which is like polls on television shows. The page on Figure 5 showing the statistic have to be refreshed manually everytime to show latest results but this depends on the services provided by the LMS, though a bit implementation of asynchronous JavaScript and XML (AJAX) or the newest method JavaScript Object Notation (JSON) can make it more real time where the page updates automatically. In short this process can be a heavy burden for the surveyor if using paper based while using this method there is no need to go through this process which can save quite a lot of labor energy and time. In the end, the total time consumption on Figure 3 is shorter because for this method because it does not need to go through post data collecting process.
Device’s Performance Measurement
As said on the previous section the authors currently unable to conduct larger field testing, therefore a simulation was done instead using Funkload to simulate up to a hundred virtual users conducting this survey. From Nah (2007) a tolerable waiting time for information retrieval is approximately 2 seconds, and from Baily (2001) around 5 seconds is still ok, and 10 seconds is the maximum. For this work 10 seconds response time was taken as the maximum limit.
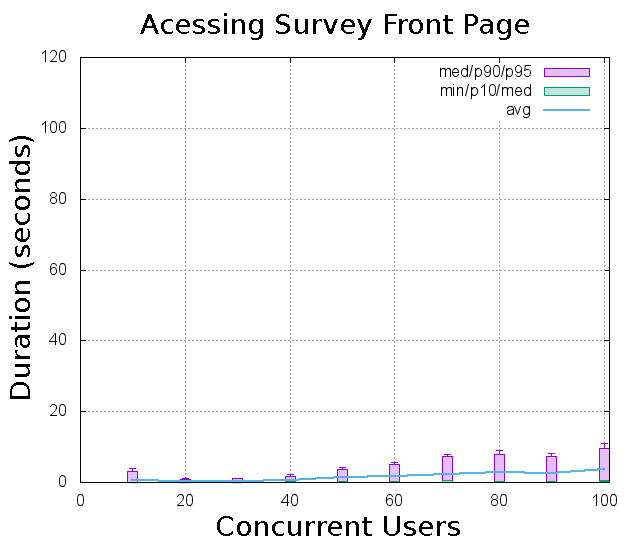
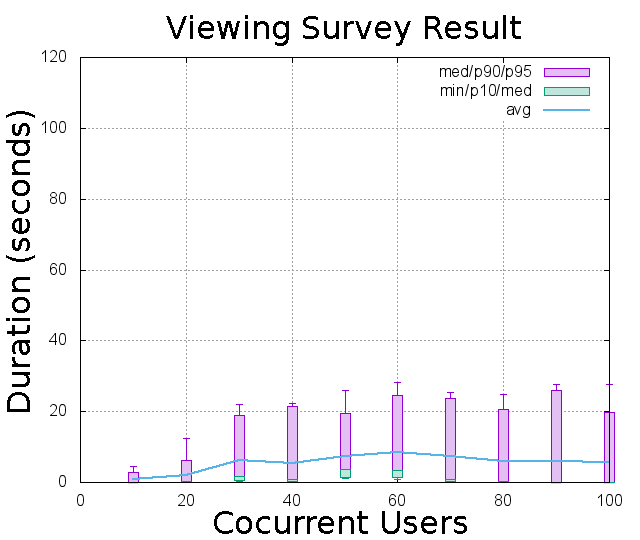
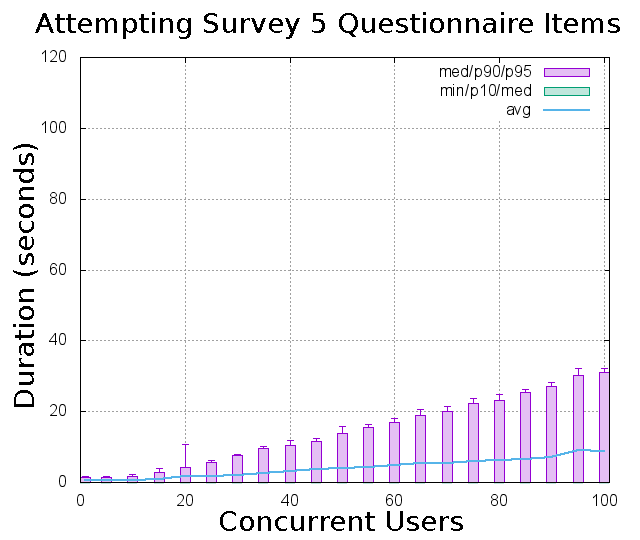
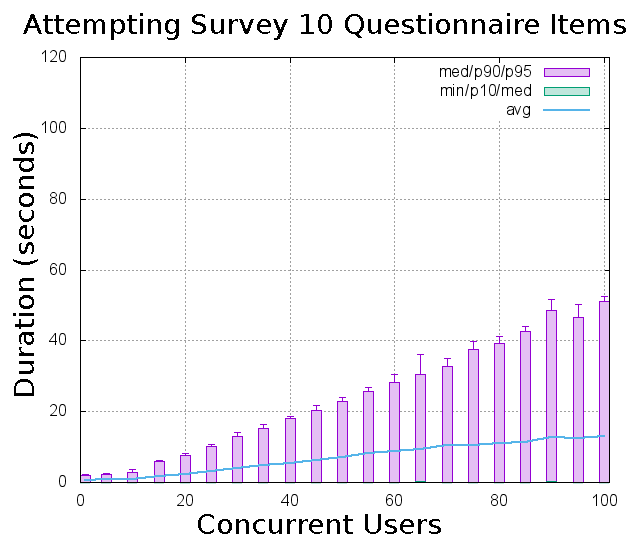
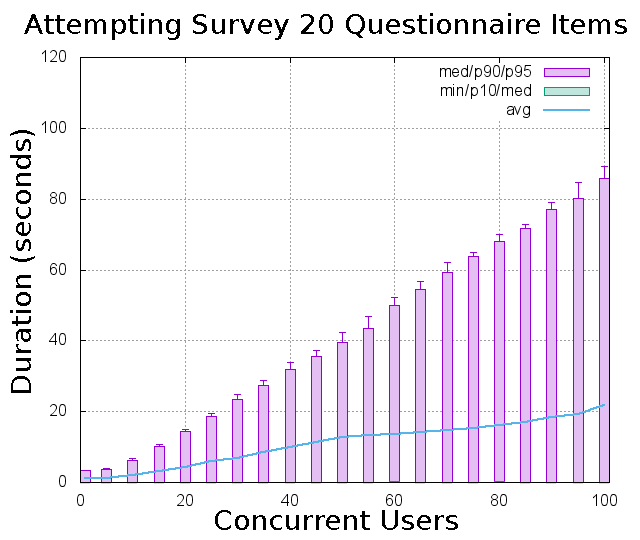
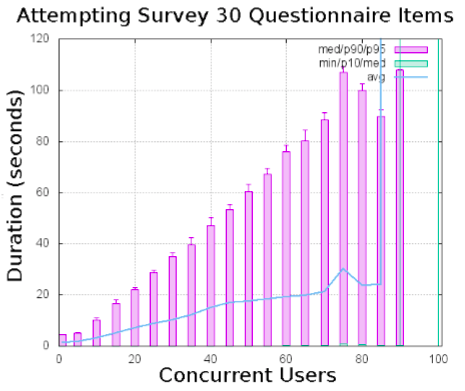
Figure 6. Response time of simulated survey process from participants side ranging up to a hundred virtual users for left images and up to a thousand virtual users for right images, top accessing survey page, middle conducting survey from answering questions to submitting answers, bottom viewing survey results.
Figure 6 showed the response time when 1 up to 100 virtual users attempted the survey. This can be said the worst case scenario since the users access the survey at the exact same time meaning all questions multiplied by up to 100 was loaded and all answers multiplied by up to 100 was submitted instantaneously. It is called worst case scenario since loading and submission at the same time almost never happen, in real scenario is a random probability which the load is always lighter. Because of this the data obtained was quite unexpected showing that it was too much to handle 100 virtual users simultaneously loading and submitting 30 questions (extra fake question to round the number) and answers as described of the questionnaire on the previous section. Therefore more experiments results with fewer questionnaire items were added which are 5, 10, and 20 items.
For the real case of 30 items, if guaranteed below 10 seconds response time is seek then 10 users at a time is the maximum, if average of 10 seconds is still okay then it can handle up to 30 users (matches quite well with Figure 4). If longer time is alright then it can take up to 85 users before failure occurs and finally the service broke after 90 virtual users where restart of web and database server was required. Though fewer questionnaire items allows faster response time. For items of 20, 10, and 5 the maximum of 10 seconds occurred respectively at 15, 25, and 30 virtual users, while average of 10 seconds occurred at 45, 70, and 100 virtual users. Why does the number of items relates to response time? Because the user will have to load the items on the web browser when attempting the survey. To be more specific, the user requests and the web server transmits, and the more the items, the more transmission took place. Also after the attempt the users will have to send its response where the more the items the more the responses that must be sent. Again Figure 6 showed the worst case where all users requests all the items and returns all its responses at the same where this case is almost unreal. Therefore more user capacity might actually be available, but referring to the data as the limit may proof reliable judgment. In short it is guaranteed.
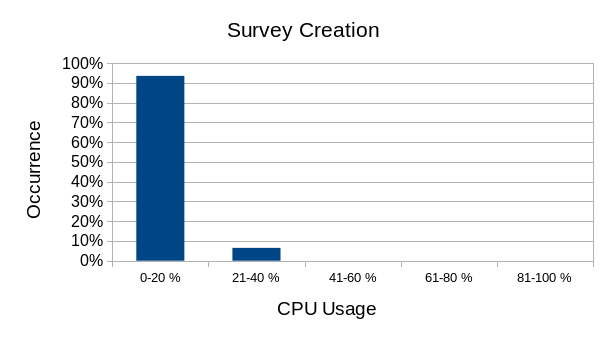
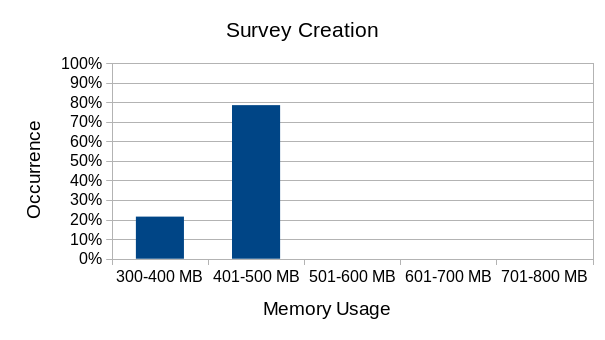
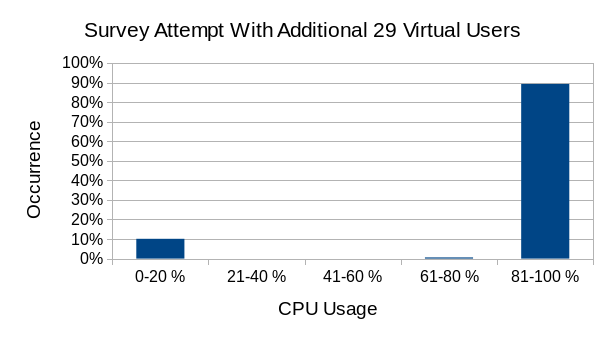
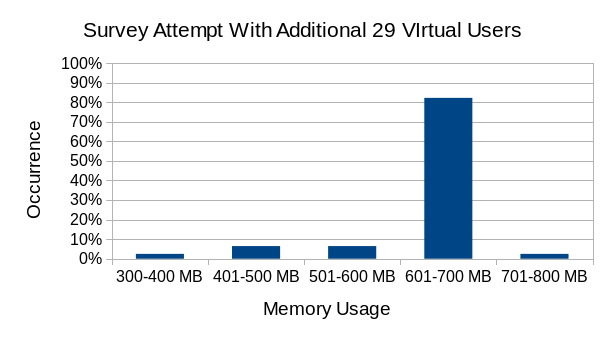
Figure 7. CPU and memory usage of top survey creation, bottom survey attempt with additional 29 virtual users.
To get the CPU and memory usage an application called Vmstat is used and ran every seconds printing the current CPU and memory usage. The method of calculation was how much of CPU and memory was free differentiate from the total CPU and memory available. Figure 7 showed the measurement that during survey creation the CPU usage was below 40% and memory usage was below 500 MB. It is expected less resource is used since only one user is creating the survey. However during survey attempt the CPU usage was mostly above 80% and memory usage was mostly above 600 MB, which is because 30 users are attempting at the same time with questionnaire of 30 items. The explanation is almost the same as response time that more computer resource is needed to allow more user attempts and more questionnaire items.
The energy consumption is measured based on how much was consumed on the power bank. The powerbank has a specification of 20000 milliampere hour (mAh). After going through all the process on Figure 3 the percentage showing on the powerbank’s monitor drops from 100%-97% meaning only using 3% and the calculation is on Equation 1 showing 0.6Ah in 39 minutes. In an hour it should use 0.92Ah which the result is quite matching to the experiment done on “Raspberry Pi FAQs” (2016). The voltage was 5 volts (V) which the current delivery will be 0.92Ah multplied by 5V and will be 4.6 watt hour (wh). In the end power delivery is not a big deal.
Conclusion and Future Work
This work shows that the hand carry server method was more convenient than the paper based method. For the time consumptions comparing the two methods, this work’s method’s showed faster result since less manual labor are done. The advantage of this work’s method is visible in post data collecting process which can provide automatic insertion of responses to the database and instantly display them in statistics in realtime. Although that it provides great convenience there are limitation due to the resource available on the hand carry server. With 5, 10, 20, and 30 number of questions on the survey, it can be guaranteed that the response time will not exceed 10 seconds if users does not exceed respectively 35, 25, 15, and 10. If beyond that is still tolerable, then the simulation showed that the average response time of 10 seconds occurred at number of virtual users of 100, 70, 45, and 30 when there are 5, 10, 20, and 30 items in the questionnaire. It’s the same for CPU and memory usage that it was mostly consumed when number users is above 30 with each loading 30 items of questionnaire. If it is just a class with average number people the device can handle it.
This work showed only some applicative which introduces the idea and yet to be implemented. There are room for improvements on its data structure, and performance. Another issue which is yet to be discussed is the privacy and reliability, for example its susceptibility to data loss and failures. Additionally synchronization may also be discussed starting from the hand carry device to the main server, then between hand carry devices if more than one is used for a survey, like how to combine the data together. In the future will also try using other more popular hand carry devices such as mobile phone whether it is possible for it to function as a portable server such as the one on this work and compare those ones with this work.
Acknowledgment
Part of this work was supported by JSPS KAKENHI Grant-in-Aid for Scientific Research 25280124 and 15H02795. The authors would like to thank Elphas Lisalitsa for willing to be a subject for the trial as a surveyor, which he was burdened with doing two kind of surveys that were paper based method and hand carry based method, starting from creating the questions, collecting the data, and inputing the data. The authors would also like to thank Otgontsetseg Sukhbaatar for providing us her questionnaire items and informing us about her survey experience using paper based in some high schools in Mongolia.
Reference
- Bailey, B. (2001). Response Times. (2017, March 03). Retrieved from http://www.humanfactors.com/newsletters/response_times.asp
- Delbosc, B. Funkload documentation contents. (2017, March 03). Retrieved from https://funkload.nuxeo.org
- Ijtihadie, R. M., Chisaki, Y., Usagawa, T., Cahyo, H. B., & Affandi, A. (2010). Offline web application and quiz synchronization for e-learning activity for mobile browser. TENCON 2010 - 2010 IEEE Region 10 Conference. doi:10.1109/tencon.2010.5685899
- Kusumo, N. S. A. M., Kurniawan, F. B., & Putri, N. I., “Learning obstacle faced by indonesian students,” in The Eighth International Conference on eLearning for Knowledge-Based Society. Bangkok, Thailand. Retrieved from http://www.elearningap.com/eLAP2011/Proceedings/paper25.pdf
- Kuziek, J. W. P., Shienh, A., & Mathewson, K. E. (2017). Transitioning EEG experiments away from the laboratory using a raspberry pi 2. Journal of Neuroscience Methods, 277, 75–82. doi:10.1016/j.jneumeth.2016.11.013
- McDaniel, M. A., Wildman, K. M., & Anderson, J. L. (2012). Using quizzes to enhance summative-assessment performance in a web-based class: An experimental study. Journal of Applied Research in Memory and Cognition, 1(1), 18–26. doi:10.1016/j.jarmac.2011.10.001
- Nah, F. F. (2004). A study on tolerable waiting time: how long are Web users willing to wait? Behaviour & Information Technology, 23(3), 153-163. doi:10.1080/01449290410001669914
- O’Connor, C., Laszewski, A., Hammel, J., & Durkin, M. S. (2017). Using portable computers in home visits: Effects on programs, data quality, home visitors and caregivers. Children and Youth Services Review, 33(7), 1318–1324. doi:10.1016/j.childyouth.2011.03.006
- Paturusi, S., Chisaki, Y., & Usagawa, T. (2015). Assessing lecturers and student’s readiness for e-learning: A preliminary study at national university in north Sulawesi Indonesia. GSTF Journal on Education (JEd), 2(2), . Retrieved from http://dl6.globalstf.org/index.php/jed/article/view/1160
- Raspberry Pi FAQs - Frequently Asked Questions. (n.d.). (2017, February 26). Retrieved from https://www.raspberrypi.org/help/faq
- T, M, M., Win, T., Oo, M, Z., & Usagawa, T. (2016). Students’ E-readiness for E-learning at Two Major Technological Universities in Myanmar. In Seventh International Conference on Science and Engineering (pp. 299-303). Yangon, Myanmar
- The World Bank Group. (2016). Internet users (per 100 people). (2017, March 06). Retrieved from http://data.worldbank.org/indicator/IT.NET.USER.P2
- The World Bank Group. (2016). Mobile cellular subscriptions (per 100 people). (2017, March 06). Retrieved from http://data.worldbank.org/indicator/IT.CEL.SETS.P2
- Wittenberg, L. (2015). MC-Live. Proceedings of the 46th ACM Technical Symposium on Computer Science Education - SIGCSE ‘15 (pp. 421-423). Kansas City, Missouri, USA. doi:10.1145/2676723.2677216
- Wright, K. (2005). Researching Internet-Based Populations: Advantages and Disadvantages of Online Survey Research, Online Questionnaire Authoring Software Packages, and Web Survey Services. Journal of Computer-Mediated Communication, 10(3), 00-00. doi:10.1111/j.1083-6101.2005.tb00259.x
Mirror
- https://www.publish0x.com/0fajarpurnama0/hand-carry-data-collecting-through-questionnaire-and-quiz-al-xwnqdgy?a=4oeEw0Yb0B&tid=github
- https://0fajarpurnama0.github.io/masters/2020/05/30/hand-carry-server-survey
- https://medium.com/@0fajarpurnama0/hand-carry-data-collecting-through-questionnaire-and-quiz-alike-using-mini-computer-raspberry-pi-716832d485b8
- https://hicc.cs.kumamoto-u.ac.jp/~fajar/masters/hand-carry-server-survey
- https://0fajarpurnama0.tumblr.com/post/619543217473503232/hand-carry-data-collecting-through-questionnaire
- https://0darkking0.blogspot.com/2020/05/hand-carry-data-collecting-through.html
- https://hive.blog/technology/@fajar.purnama/hand-carry-data-collecting-through-questionnaire-and-quiz-alike-using-mini-computer-raspberry-pi?r=fajar.purnama
- https://0fajarpurnama0.cloudaccess.host/index.php/uncategorised/46-hand-carry-data-collecting-through-questionnaire-and-quiz-alike-using-mini-computer-raspberry-pi
- https://steemit.com/technology/@fajar.purnama/hand-carry-data-collecting-through-questionnaire-and-quiz-alike-using-mini-computer-raspberry-pi?r=fajar.purnama
- http://0fajarpurnama0.weebly.com/blog/hand-carry-data-collecting-through-questionnaire-and-quiz-alike-using-mini-computer-raspberry-pi
- https://0fajarpurnama0.wixsite.com/0fajarpurnama0/post/hand-carry-data-collecting-through-questionnaire-and-quiz-alike-using-mini-computer-raspberry-pi